Showing posts with label housing demand. Show all posts

Tuesday, February 9, 2021

3 Reasons We’re Definitely Not in a Housing Bubble


3 Reasons We’re Definitely Not in a Housing Bubble

3 Reasons We’re Definitely Not in a Housing Bubble | MyKCM

Home values appreciated by about ten percent in 2020, and they’re forecast to appreciate by about five percent this year. This has some voicing concern that we may be in another housing bubble like the one we experienced a little over a decade ago. Here are three reasons why this market is totally different.

1. This time, housing supply is extremely limited

The price of any market item is determined by supply and demand. If supply is high and demand is low, prices normally decrease. If supply is low and demand is high, prices naturally increase.

In real estate, supply and demand are measured in “months’ supply of inventory,” which is based on the number of current homes for sale compared to the number of buyers in the market. The normal months’ supply of inventory for the market is about 6 months. Anything above that defines a buyers’ market, indicating prices will soften. Anything below that defines a sellers’ market in which prices normally appreciate.

Between 2006 and 2008, the months’ supply of inventory increased from just over 5 months to 11 months. The months’ supply was over 7 months in twenty-seven of those thirty-six months, yet home values continued to rise.

Months’ inventory has been under 5 months for the last 3 years, under 4 for thirteen of the last fourteen months, under 3 for the last six months, and currently stands at 1.9 months – a historic low.

Remember, if supply is low and demand is high, prices naturally increase.

2. This time, housing demand is real

During the housing boom in the mid-2000s, there was what Robert Schiller, a fellow at the Yale School of Management's International Center for Finance, called “irrational exuberance.” The definition of the term is, “unfounded market optimism that lacks a real foundation of fundamental valuation, but instead rests on psychological factors.” Without considering historic market trends, people got caught up in the frenzy and bought houses based on an unrealistic belief that housing values would continue to escalate.

The mortgage industry fed into this craziness by making mortgage money available to just about anyone, as shown in the Mortgage Credit Availability Index (MCAI) published by the Mortgage Bankers Association. The higher the index, the easier it is to get a mortgage; the lower the index, the more difficult it is to obtain one. Prior to the housing boom, the index stood just below 400. In 2006, the index hit an all-time high of over 868. Again, just about anyone could get a mortgage. Today, the index stands at 122.5, which is well below even the pre-boom level.

In the current real estate market, demand is real, not fabricated. Millennials, the largest generation in the country, have come of age to marry and have children, which are two major drivers for homeownership. The health crisis is also challenging every household to redefine the meaning of “home” and to re-evaluate whether their current home meets that new definition. This desire to own, coupled with historically low mortgage rates, makes purchasing a home today a strong, sound financial decision. Therefore, today’s demand is very real.

Remember, if supply is low and demand is high, prices naturally increase.

3. This time, households have plenty of equity

Again, during the housing boom, it wasn’t just purchasers who got caught up in the frenzy. Existing homeowners started using their homes like ATM machines. There was a wave of cash-out refinances, which enabled homeowners to leverage the equity in their homes. From 2005 through 2007, Americans pulled out $824 billion dollars in equity. That left many homeowners with little or no equity in their homes at a critical time. As prices began to drop, some homeowners found themselves in a negative equity situation where the mortgage was higher than the value of their home. Many defaulted on their payments, which led to an avalanche of foreclosures.

Today, the banks and the American people have shown they learned a valuable lesson from the housing crisis a little over a decade ago. Cash-out refinance volume over the last three years was less than a third of what it was compared to the 3 years leading up to the crash.

This conservative approach has created levels of equity never seen before. According to Census Bureau data, over 38% of owner-occupied housing units are owned ‘free and clear’ (without any mortgage). Also, ATTOM Data Solutions just released their fourth quarter 2020 U.S. Home Equity Report, which revealed:

“17.8 million residential properties in the United States were considered equity-rich, meaning that the combined estimated amount of loans secured by those properties was 50 percent or less of their estimated market value…The count of equity-rich properties in the fourth quarter of 2020 represented 30.2 percent, or about one in three, of the 59 million mortgaged homes in the United States.”

If we combine the 38% of homes that are owned free and clear with the 18.7% of all homes that have at least 50% equity (30.2% of the remaining 62% with a mortgage), we realize that 56.7% of all homes in this country have a minimum of 50% equity. That’s significantly better than the equity situation in 2008.

Bottom Line

This time, housing supply is at a historic low. Demand is real and rightly motivated. Even if there were to be a drop in prices, homeowners have enough equity to be able to weather a dip in home values. This is nothing like 2008. In fact, it’s the exact opposite.

Wednesday, September 16, 2020

The Surging Real Estate Market Continues to Climb


The Surging Real Estate Market Continues to Climb

The Surging Real Estate Market Continues to Climb | MyKCM

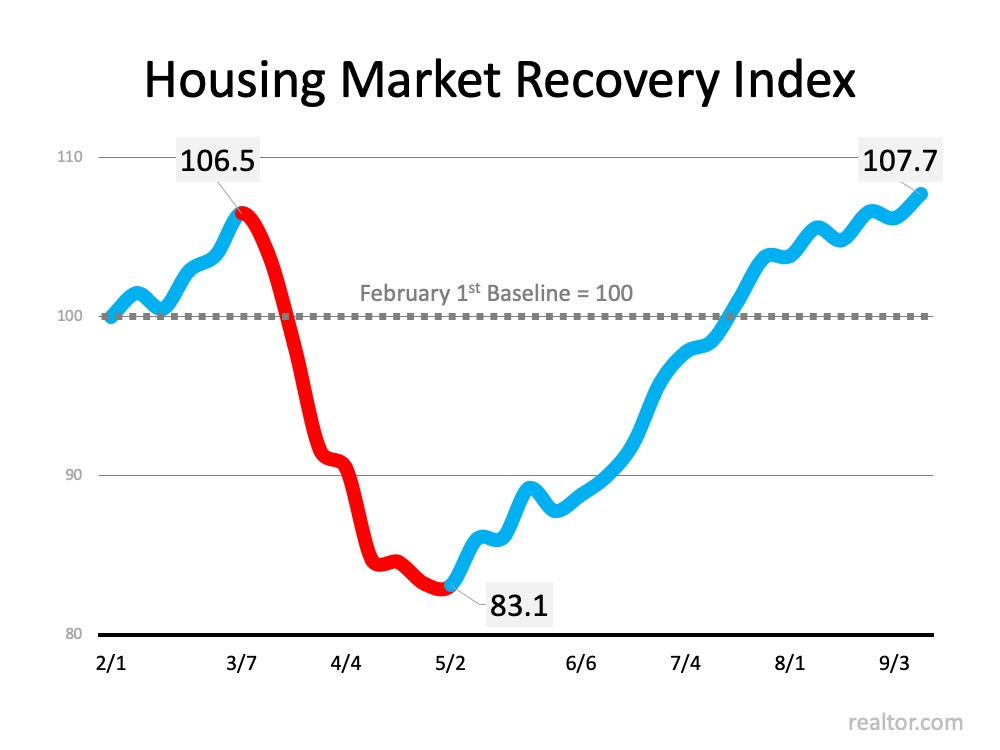
Earlier this year, realtor.com announced the release of the Housing Recovery Index, a weekly guide showing how the pandemic has impacted the residential real estate market. The index leverages a weighted average of four key components of the housing industry by tracking each of the following:

  1. Housing Demand – Growth in online search activity
  2. Home Price – Growth in asking prices
  3. Housing Supply – Growth of new listings
  4. Pace of Sales – Difference in time-on-market

The index compares the current status “to the January 2020 market trend, as a baseline for pre-COVID market growth. The overall index is set to 100 in this baseline period. The higher a market’s index value, the higher its recovery and vice versa.”

The graph below charts the index by showing how the real estate market started out strong in early 2020, and then dropped dramatically at the beginning of March when the pandemic paused the economy. It also shows the strength of the recovery since the beginning of May.The Surging Real Estate Market Continues to Climb | MyKCMToday, the index stands at its highest point all year, including the time prior to the economic shutdown.

The Momentum Is Still Building

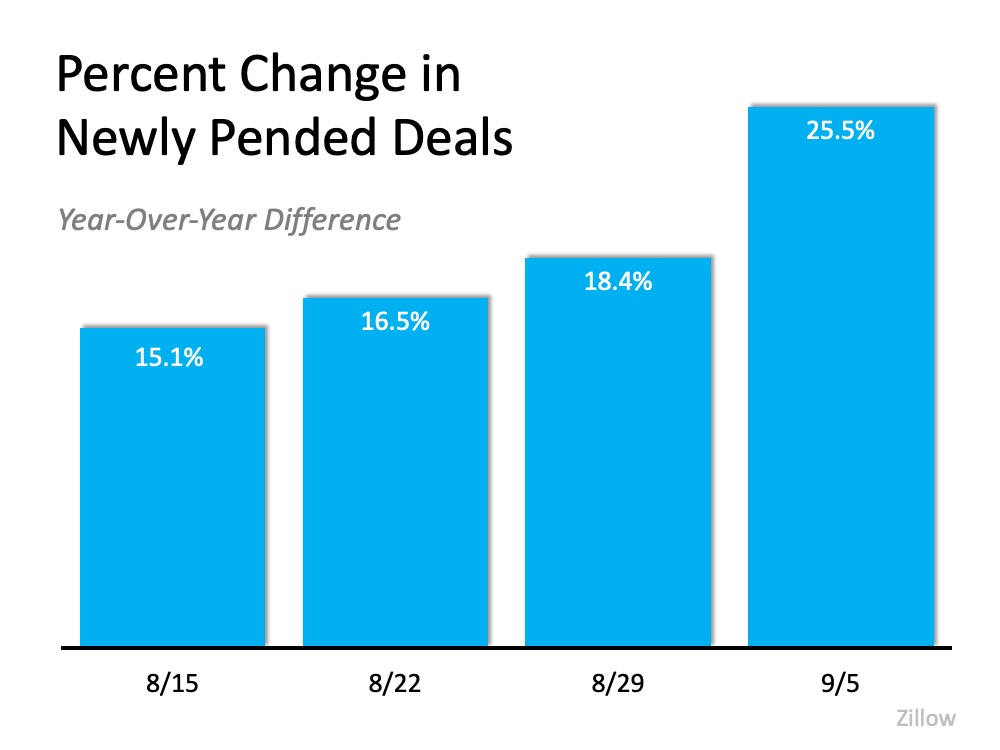
Though there is some evidence that the overall economic recovery may be slowing, the housing market is still gaining momentum. Zillow tracks the number of homes that are put into contract on a weekly basis. Their latest report confirms that buyer demand is continuing to dramatically outpace this same time last year, and the percent increase over last year is growing.The Surging Real Estate Market Continues to Climb | MyKCMClearly, the housing market is not only outperforming the grim forecasts from earlier this year, but it is also eclipsing the actual success of last year.

Frank Martell, President and CEO of CoreLogicexplains it best:

“On an aggregated level, the housing economy remains rock solid despite the shock and awe of the pandemic.”

Bottom Line

Whether you’re considering buying or selling, staying on top of the real estate market over the coming months will be essential to your success.

Wednesday, September 2, 2020

How Will the Presidential Election Impact Real Estate?


How Will the Presidential Election Impact Real Estate?

How Will the Presidential Election Impact Real Estate? | MyKCM

The year 2020 will be remembered as one of the most challenging times of our lives. A worldwide pandemic, a recession causing historic unemployment, and a level of social unrest perhaps never seen before have all changed the way we live. Only the real estate market seems to be unaffected, as a new forecast projects there may be more homes purchased this year than last year.

As we come to the end of this tumultuous year, we’re preparing for perhaps the most contentious presidential election of the century. Today, it’s important to look at the impact past presidential election years have had on the real estate market.

Is there a drop-off in home sales during a presidential election year?

BTIG, a research and analysis company, looked at new home sales from 1963 through 2019 in their report titled One House, Two House, Red House, Blue House. They noted that in non-presidential years, there is a -9.8% decrease in November compared to October. This is the normal seasonality of the market, with a slowdown in activity that’s usually seen in fall and winter.

However, it also revealed that in presidential election years, the typical drop increases to -15%. The report explains why:

“This may indicate that potential homebuyers may become more cautious in the face of national election uncertainty.”

Are those sales lost forever?

No. BTIG determined:

“This caution is temporary, and ultimately results in deferred sales, as the economy, jobs, interest rates and consumer confidence all have far more meaningful roles in the home purchase decision than a Presidential election result in the months that follow.”

In a separate study done by Meyers Research & Zonda, Ali Wolf, Chief Economist, agrees that those purchases are just delayed until after the election:

“History suggests that the slowdown is largely concentrated in the month of November. In fact, the year after a presidential election is the best of the four-year cycle. This suggests that demand for new housing is not lost because of election uncertainty, rather it gets pushed out to the following year.”

Will it matter who is elected?

To some degree, but not in the overall number of home sales. As mentioned above, consumer confidence plays a significant role in a family’s desire to buy a home. How may consumer confidence impact the housing market post-election? The BTIG report covered that as well:

“A change in administration might benefit trailing blue county housing dynamics. The re-election of President Trump could continue to propel red county outperformance.”

Again, overall sales should not be impacted in a significant way.

Bottom Line

If mortgage rates remain near all-time lows, the economy continues to recover, and unemployment continues to decrease, the real estate market should remain strong up to and past the election.

Tuesday, August 25, 2020

Builders & Realtors Agree: Real Estate Is Back


Builders & Realtors Agree: Real Estate Is Back

Builders & Realtors Agree: Real Estate Is Back | MyKCM

When shelter-in-place orders brought the economy to a screeching halt earlier this year, many believed the residential housing market would follow suit. Countless analysts predicted buyer demand would disappear and home values would depreciate for the first time in almost a decade. That, however, didn’t happen. It appears the opposite is taking place.

After the bottom fell out of the real estate market immediately following the shutdown, it has come roaring back – and seems to still be gaining steam. Here’s a look at two recent reports – one from the National Association of Home Builders (NAHB) and one from the National Association of Realtors (NAR) – showing this growing strength.

Builder Confidence Hits All-Time High

Last week, it was reported that applications for new home purchases with home builders were 39% higher than in July of 2019. That has builder confidence soaring.

Each month, NAHB releases its Housing Market Index, a survey of NAHB members who rate market conditions for the sale of new homes at the present time and over the next six months, as well as prospective buyer traffic for new homes.

This month, they reported that builder confidence in the market for newly-built single-family homes increased to the highest reading in the 35-year history of the series. NAHB Chairman, Chuck Fowke, explained:

“The demand for new single-family homes continues to be strong, as low interest rates and a focus on the importance of housing has stoked buyer traffic to all-time highs…Housing has clearly been a bright spot during the pandemic and the sharp rebound in builder confidence over the summer has led NAHB to upgrade its forecast for single-family starts, which are now projected to show only a slight decline for 2020.”

The number of newly constructed homes being built will be almost at the same level as last year, even though the economic shutdown crushed home building earlier in the year.

Existing Homes Are Also Selling Like Hotcakes

Last Friday, NAR released its Existing Home Sales Report. The report revealed that month-over-month sales increased by 24.7%, setting another record for the category. The Wall Street Journal reported that the increase crushed expert forecasts:

“Economists surveyed by The Wall Street Journal expected a 14.2% monthly increase in sales of previously-owned homes, which make up most of the housing market.”

Home sales increased by 8.7% year-over-year.

Lawrence Yun, Chief Economist for NAR, explained how the resale market is just as hot as the new construction market:

“The housing market is well past the recovery phase and is now booming with higher home sales compared to the pre-pandemic days. With the sizable shift in remote work, current homeowners are looking for larger homes and this will lead to a secondary level of demand even into 2021.”

In addition, the Housing Market Recovery Index, which is released monthly by realtor.com, also showed the market is recovering nicely. The latest index reading was 104.8, which means the housing market is doing better than it was in January and February of this year. As a reference, the highest point in the index was a 106.5 in early March, just prior to the health crisis setting in.

Bottom Line

Both the newly constructed and existing home sale markets are posting numbers greater than a year ago. Real estate is back. If you’re thinking of buying or selling, let’s connect so you have the expert counsel you need along the way.

Monday, August 3, 2020

Experts Weigh-In on the Remarkable Strength of the Housing Market

Experts Weigh-In on the Remarkable Strength of the Housing Market

Experts Weigh-In on the Remarkable Strength of the Housing Market | MyKCM

America has faced its share of challenges in 2020. A once-in-a-lifetime pandemic, a financial crisis leaving millions still unemployed, and an upcoming presidential election that may prove to be one of the most contentious in our nation’s history all continue to test this country in unimaginable ways.

Even with all of that uncertainty, the residential real estate market continues to show great resilience. Here’s a look at what the experts have said about the housing market over the past few weeks.

Ivy Zelman, CEO of Zelman & Associates:

“Whether in terms of pending contract activity or our proprietary buyer demand ratings, the various measures of demand captured in this month’s survey can only be described as shockingly strong, in spite of the resurgence in COVID-19 cases.”

Logan Mohtashami, Lead Housing Analyst at HousingWire:

“Existing home sales are still down year over year by 11.3%, but as crazy as this might sound, we have a shot at getting positive year-over-year growth…We may see an existing home sales print of 5,510,000 in 2020.”

Matthew Speakman, Zillow Economist:

“In a remarkable show of resilience, the housing market has stared the pandemic right in the eye and hasn’t blinked.”

Todd Teta, Chief Product Officer for ATTOM Data Solutions:

“The housing market across the United States pulled something of a high-wire act in the second quarter, surging forward despite the encroaching economic headwinds resulting from the Coronavirus pandemic.”

Ali Wolf, Chief Economist of Meyers Research:

“The housing recovery has been nothing short of remarkable. The expectation was that housing would be crushed. It was—for about two months—and then it came roaring back.”

Clare Trapasso, Senior News Editor of realtor.com:

“Despite the crippling and ongoing coronavirus pandemic, millions out of work, a recession, a national reckoning over systemic racism, and a highly contentious presidential election just around the corner, the residential real estate market is staging an astonishing rebound.”

Bill Banfield, EVP of Capital Markets at Quicken Loans:

“The pandemic has not stopped the consistent home price growth we have witnessed in recent years.”

Economic & Strategic Research Group at Fannie Mae:

Recent home purchase measures have continued to show remarkable strength, leading us to revise upward our home sales forecast, particularly over the third quarter. Similarly, we bumped up our expectations for home price growth and purchase mortgage originations.”

Mark Fleming, Chief Economist at First American:

“It seems hard to deny that when one looks at many of the housing market statistics, a “V” shape is quite apparent.”

Bottom Line

The experts seem to agree that residential real estate is doing remarkably well. If you’re thinking of jumping into the housing market (whether buying or selling), this may be the perfect time.

Wednesday, July 8, 2020

Best Time to Sell? When Competition Is at an All-Time Low

Best Time to Sell? When Competition Is at an All-Time Low

Best Time to Sell? When Competition Is at an All-Time Low | MyKCM

In a recent survey of home sellers by Qualtrics, 87% of respondents said they were concerned their home won’t sell because of the pandemic and resulting economic recession. Of the respondents, 51% said they are “seriously worried.” That concern seems reasonable considering the current condition of the economy. The data, however, is showing that home purchasers are still very active despite the disruptions American families have experienced this year.

The latest Existing Home Sales Report published by the National Association of Realtors (NAR) revealed that 340,000 single-family homes sold in this country last month. NAR’s most recent Pending Sales Report (homes going into contract) surpassed last month’s number by over 44%, which far exceeded analysts’ projections of 15%. ShowingTime reported that appointments to see homes (both virtually and in-person) have increased in every region of the country and are up 21.4% nationwide over the same time last year.

While buyer activity is surging, the number of listings has fallen to an all-time low. Zelman Associates, in their latest residential real estate report, revealed that housing inventory as a percentage of households has fallen to 1.2%, which is half of the long-term average and lower than any other time in our history.

Bidding Wars Heating Up Again

With buyer demand growing and the supply of available homes shrinking, purchasers are again finding themselves needing to outbid other buyers. NAR, in a recent blog post, revealed:

“On average, there were about three offers on a home that closed in May, up from just about two in April 2020 and in May 2019 (2.3 offers).”

Bidding wars guarantee houses sell quickly at a price near or even slightly over the listing price.

Bottom Line

If you’re thinking of selling, don’t be concerned about putting your house on the market right now. There’s no better time to sell an item than when demand for it is high and supply is low. It is exactly at that time when you will negotiate your best possible deal.

Wednesday, November 13, 2019

Home Buyer Demand Growing in Every Region

Buyer Demand Growing in Every Region

Buyer Demand Growing in Every Region | MyKCM

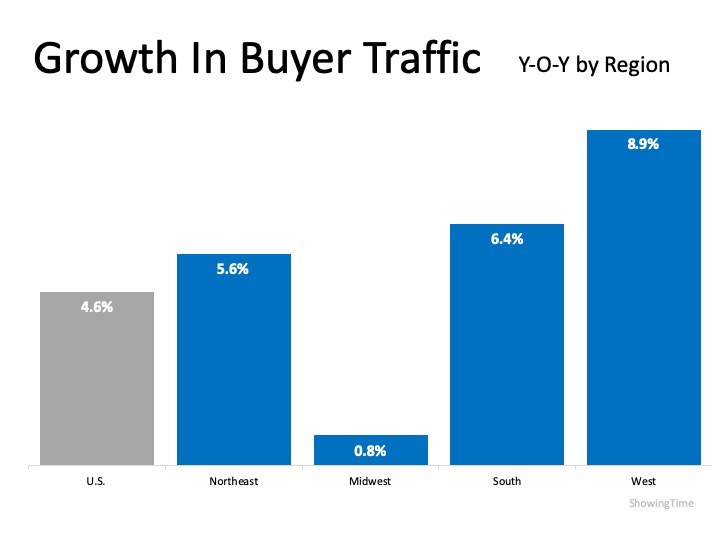
Buyers are out in full force this fall, increasing the demand for homebuying in all four regions of the country.
According to the latest ShowingTime Showing Index,
“Home showing activity was up again nationwide with a 4.6 percent rise in traffic, as the traditionally slow fall season began with a marked boost in buyer interest.”
Buyers clearly have the right idea, as mortgage rates have dropped over a full percentage point since the fall of 2018. They’ve hovered in a historically low range since this summer, making the overall cost of homeownership significantly more attractive and affordable.
Here’s the breakdown of how ShowingTime reports current buyer traffic patterns across the country:
“The West Region, which until August had experienced 18 consecutive months of flagging home buyer traffic, lead the four regions in year-over-year improvement with an 8.9 percent increase in buyer activity.
The South followed with a 6.4 percent increase, the largest such improvement in the region since April 2018, with the Northeast Region’s 5.6 percent increase the next largest among the four regions.
The Midwest’s more modest 0.8 percent year-over-year growth rounded out the nation’s promising month.”
Buyer Demand Growing in Every Region | MyKCMWith ShowingTime reporting “nationwide growth for the second consecutive month, a first since December 2017 – January 2018”, it’s one more reason why selling your house this winter is the way to go. List while buyers are on the market, before competition with other sellers pops up in your neighborhood.

Bottom Line

If you’re thinking of waiting until spring to sell, think again! Let’s get together to discuss listing your house now while buyer traffic is actively surging throughout the country.

Monday, September 30, 2019

How Does the Supply of Homes for Sale Impact Buyer Demand?

How Does the Supply of Homes for Sale Impact Buyer Demand? | MyKCM

The price of any item is determined by supply, as well as the market’s demand for the item. The National Association of REALTORS (NAR) surveys “over 50,000 real estate practitioners about their expectations for home sales, prices and market conditions” for their monthly REALTORS Confidence Index.
Their latest edition sheds some light on the relationship between seller traffic (supply) and buyer traffic (demand).

Buyer Demand

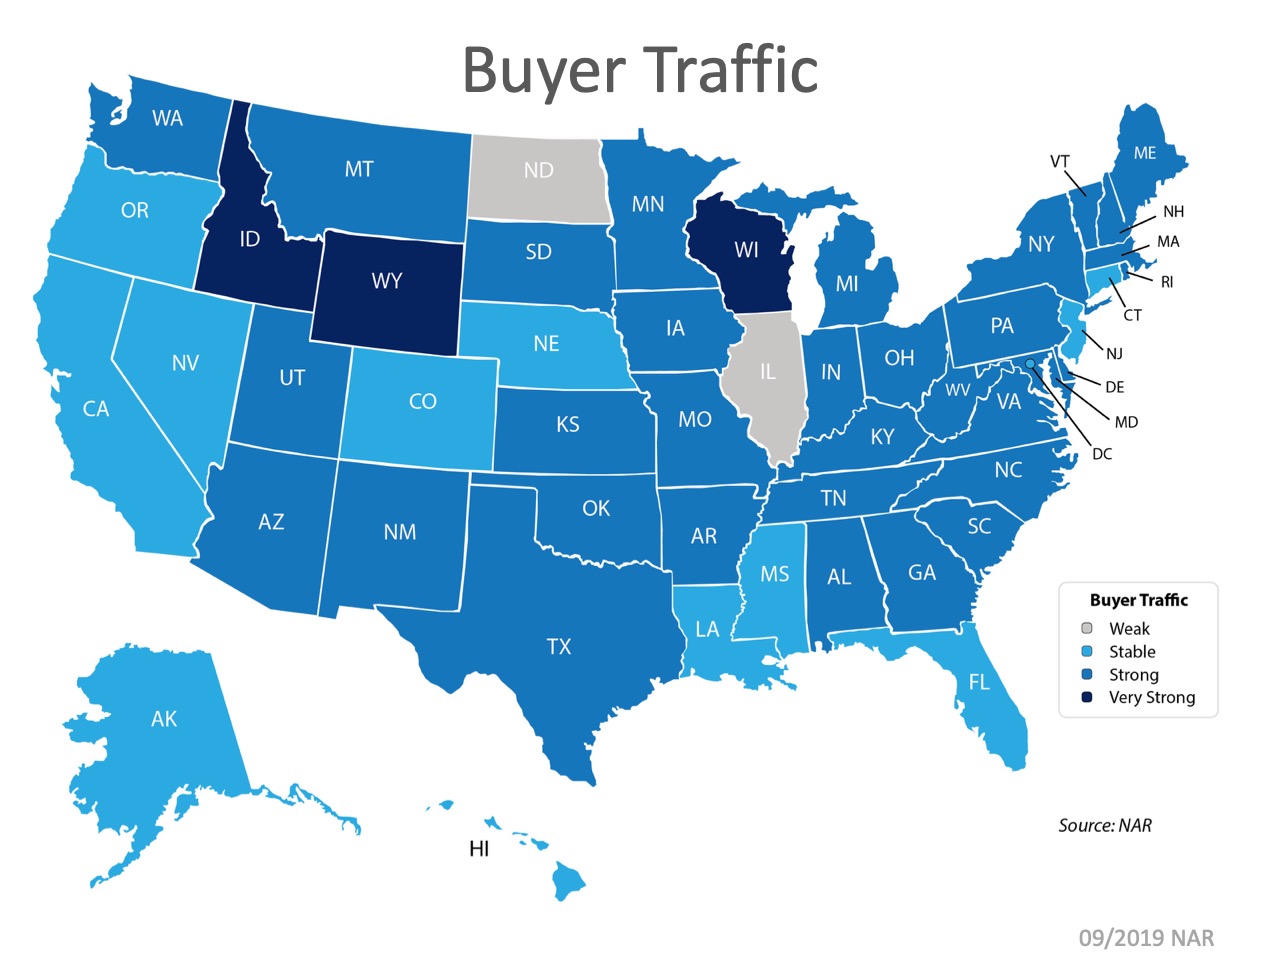
The map below was created after asking the question: “How would you rate buyer traffic in your area?”How Does the Supply of Homes for Sale Impact Buyer Demand? | MyKCMThe darker the blue, the stronger the demand for homes is in that area. The survey shows that in 3 of the 50 U.S. states, buyer demand is now very strong; only 2 of the 50 states have a ‘weak’ demand. Overall, buyer demand is slightly lower than this time last year but remains strong.

Seller Supply 

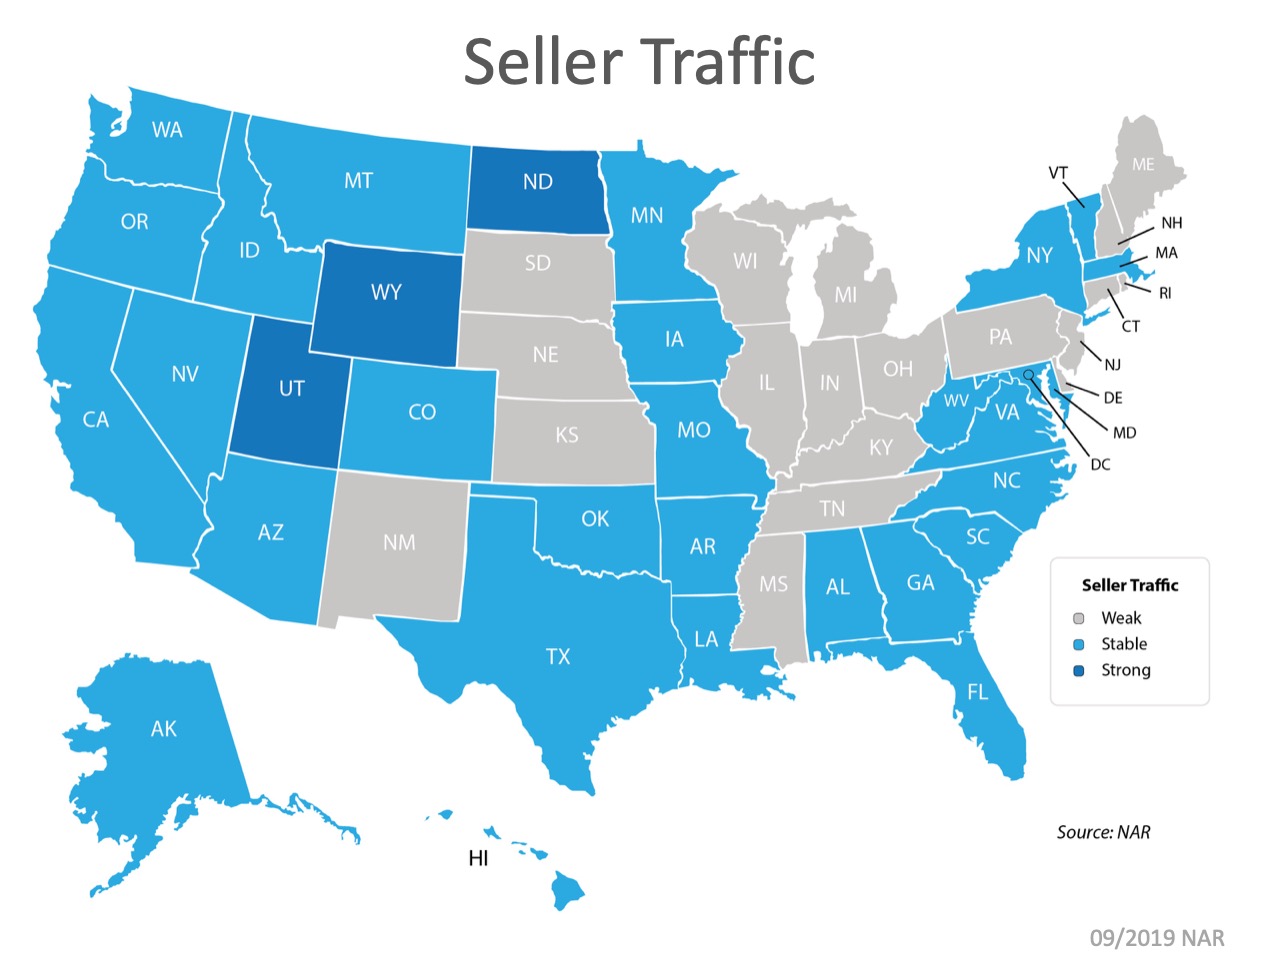
The index also asked: “How would you rate seller traffic in your area?”How Does the Supply of Homes for Sale Impact Buyer Demand? | MyKCMAs the map below shows, 18 states reported ‘weak’ seller traffic, 29 states and Washington, D.C. reported ‘stable’ seller traffic, and 3 states reported ‘strong’ seller traffic. This means there are far fewer homes on the market than what is needed to satisfy the buyers who are looking for homes.

Bottom Line

Looking at the maps above, it is not hard to see why prices are appreciating in many areas of the country. Until the supply of homes for sale starts to meet buyer demand, prices will continue to increase. If you are debating listing your home for sale, let’s get together to help you capitalize on the demand in our market now.