Showing posts with label housing bubble. Show all posts

Tuesday, July 20, 2021

3 Charts That Show This Isn’t a Housing Bubble


3 Charts That Show This Isn’t a Housing Bubble

3 Charts That Show This Isn’t a Housing Bubble | MyKCM

With home prices continuing to deliver double-digit increases, some are concerned we’re in a housing bubble like the one in 2006. However, a closer look at the market data indicates this is nothing like 2006 for three major reasons.

1. The housing market isn’t driven by risky mortgage loans.

Back in 2006, nearly everyone could qualify for a loan. The Mortgage Credit Availability Index (MCAI) from the Mortgage Bankers’ Association is an indicator of the availability of mortgage money. The higher the index, the easier it is to obtain a mortgage. The MCAI more than doubled from 2004 (378) to 2006 (869). Today, the index stands at 130. As an example of the difference between today and 2006, let’s look at the volume of mortgages that originated when a buyer had less than a 620 credit score.3 Charts That Show This Isn’t a Housing Bubble | MyKCMDr. Frank Nothaft, Chief Economist for CoreLogic, reiterates this point:
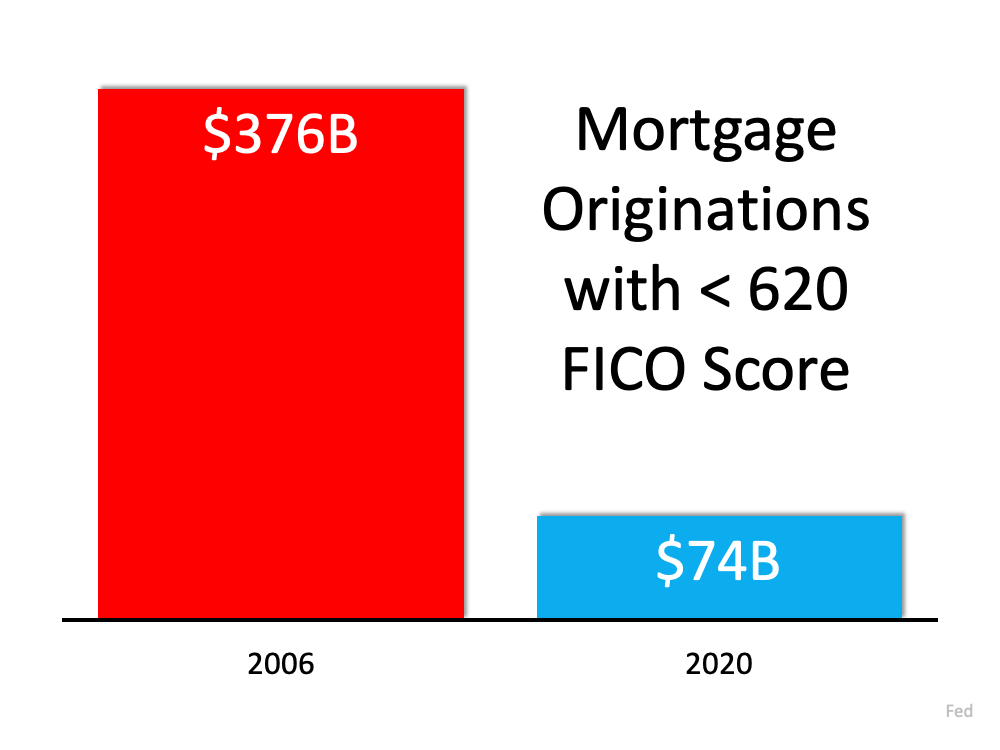
“There are marked differences in today’s run up in prices compared to 2005, which was a bubble fueled by risky loans and lenient underwriting. Today, loans with high-risk features are absent and mortgage underwriting is prudent.”

2. Homeowners aren’t using their homes as ATMs this time.

During the housing bubble, as prices skyrocketed, people were refinancing their homes and pulling out large sums of cash. As prices began to fall, that caused many to spiral into a negative equity situation (where their mortgage was higher than the value of the house).

Today, homeowners are letting their equity build. Tappable equity is the amount available for homeowners to access before hitting a maximum 80% combined loan-to-value ratio (thus still leaving them with at least 20% equity). In 2006, that number was $4.6 billion. Today, that number stands at over $8 billion.

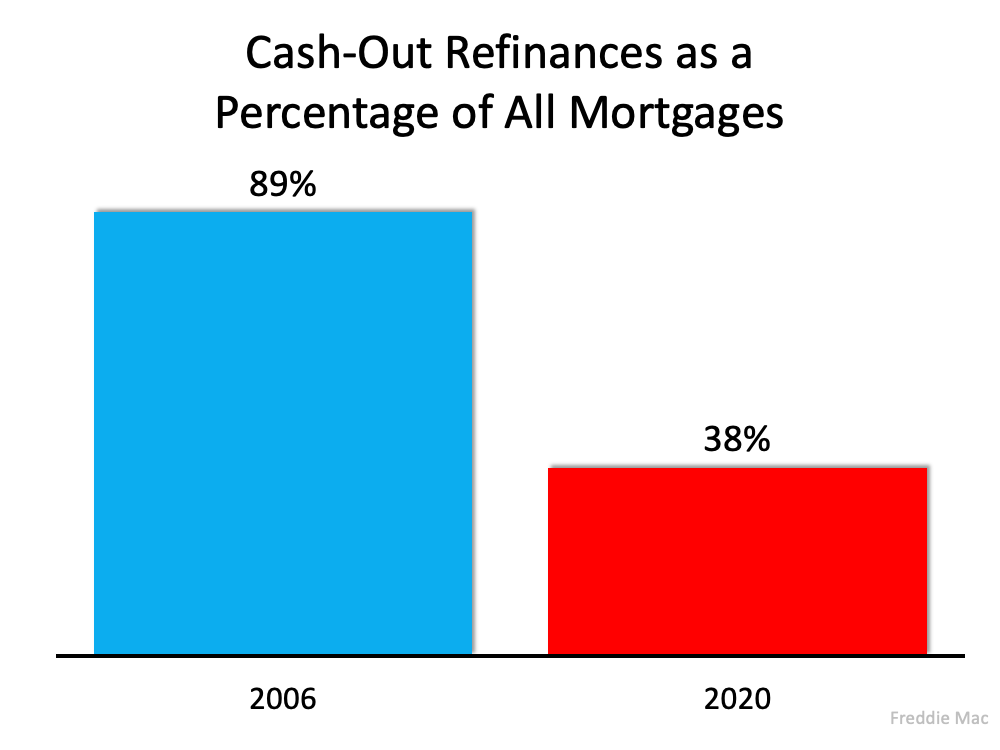
Yet, the percentage of cash-out refinances (where the homeowner takes out at least 5% more than their original mortgage amount) is half of what it was in 2006.3 Charts That Show This Isn’t a Housing Bubble | MyKCM
3. This time, it’s simply a matter of supply and demand.

FOMO (the Fear Of Missing Out) dominated the housing market leading up to the 2006 housing bubble and drove up buyer demand. Back then, housing supply more than kept up as many homeowners put their houses on the market, as evidenced by the over seven months’ supply of existing housing inventory available for sale in 2006. Today, that number is barely two months.

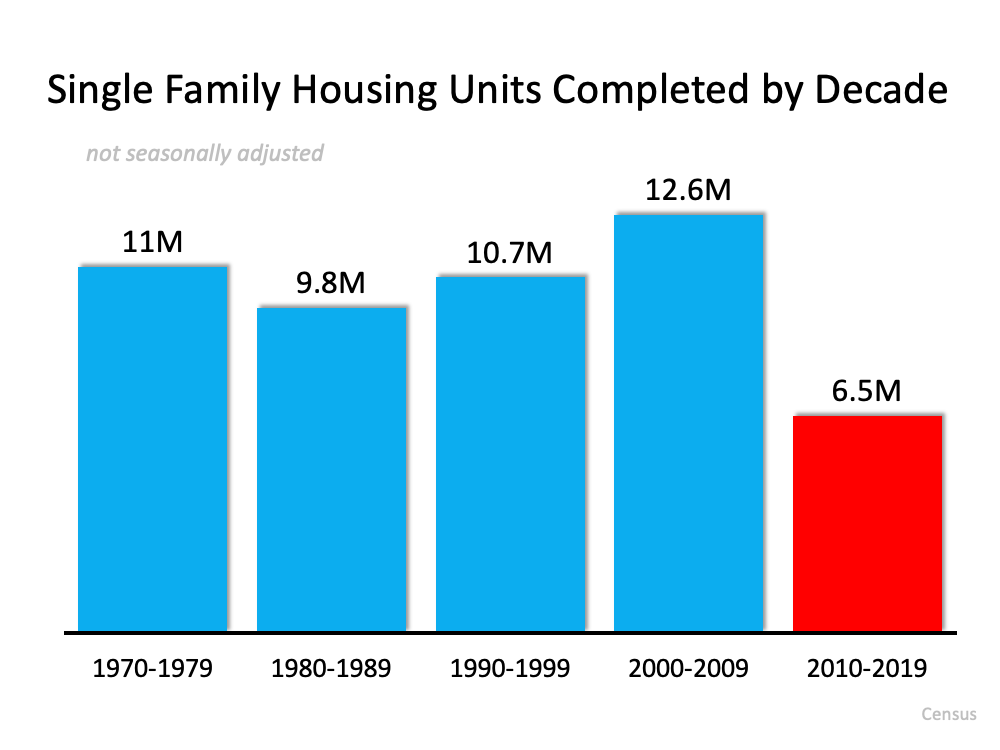
Builders also overbuilt during the bubble but pulled back significantly over the next decade. Sam Khater, VP and Chief Economist, Economic & Housing Research at Freddie Macexplains that pullback is the major factor in the lack of available inventory today:

“The main driver of the housing shortfall has been the long-term decline in the construction of single-family homes.”

Here’s a chart that quantifies Khater’s remarks:3 Charts That Show This Isn’t a Housing Bubble | MyKCMToday, there are simply not enough homes to keep up with current demand.
Bottom Line

This market is nothing like the run-up to 2006. Bill McBride, the author of the prestigious Calculated Risk blog, predicted the last housing bubble and crash. This is what he has to say about today’s housing market:

“It’s not clear at all to me that things are going to slow down significantly in the near future. In 2005, I had a strong sense that the hot market would turn and that, when it turned, things would get very ugly. Today, I don’t have that sense at all, because all of the fundamentals are there. Demand will be high for a while because Millennials need houses. Prices will keep rising for a while because inventory is so low.”

Thursday, July 1, 2021

Are We in a Housing Bubble? Experts Say No.


Are We in a Housing Bubble? Experts Say No.

Are We in a Housing Bubble? Experts Say No. | MyKCM

The question of whether the real estate market is a bubble ready to pop seems to be dominating a lot of conversations – and everyone has an opinion. Yet, when it comes down to it, the opinions that carry the most weight are the ones based on experience and expertise.

Here are four expert opinions from professionals and organizations that have devoted their careers to giving great advice to the housing industry.

The Joint Center for Housing Studies in their The State of the Nation’s Housing 2021 report:

“… conditions today are quite different than in the early 2000s, particularly in terms of credit availability. The current climb in house prices instead reflects strong demand amid tight supply, helped along by record-low interest rates.”

Nathaniel Karp, Chief U.S. Economist at BBVA:

“The housing market is in line with fundamentals as interest rates are attractive and incomes are high due to fiscal stimulus, making debt servicing relatively affordable and allowing buyers to qualify for larger mortgages. Underwriting standards are still strong, so there is little risk of a bubble developing.”

Bill McBride of Calculated Risk:

“It’s not clear at all to me that things are going to slow down significantly in the near future. In 2005, I had a strong sense that the hot market would turn and that, when it turned, things would get very ugly. Today, I don’t have that sense at all, because all of the fundamentals are there. Demand will be high for a while, because Millennials need houses. Prices will keep rising for a while, because inventory is so low.”

Mark Fleming, Chief Economist at First American:

Looking back at the bubble years, house prices exceeded house-buying power in 2006 nationally, but today house-buying power is nearly twice as high as the median sale price nationally…

Many find it hard to believe, but housing is actually undervalued in most markets and the gap between house-buying power and sale prices indicates there’s room for further house price growth in the months to come.”

Bottom Line

All four strongly believe that we’re not in a bubble and won’t see crashing home values as we did in 2008. And they’re not alone – Goldman Sachs, JP Morgan, Morgan Stanley, and Merrill Lynch share the same opinion.

Friday, April 23, 2021

This Isn’t a Bubble. It’s Simply Lack of Supply. [INFOGRAPHIC]


This Isn’t a Bubble. It’s Simply Lack of Supply. [INFOGRAPHIC]

This Isn’t a Bubble. It’s Simply Lack of Supply. [INFOGRAPHIC] | MyKCM

Some Highlights

  • In a recent article, Lawrence Yun, Chief Economist for the National Association of Realtors (NAR), discussed the state of today’s housing market.
  • When addressing whether or not today’s high buyer competition and rising home prices are evidence of a housing bubble, Yun said that this “is not a bubble. It is simply lack of supply.”
  • Today’s housing market is healthy, and rising prices are driven by real buyer demand. Let’s connect to talk about the best ways to navigate such an energetic market.

Tuesday, February 9, 2021

3 Reasons We’re Definitely Not in a Housing Bubble


3 Reasons We’re Definitely Not in a Housing Bubble

3 Reasons We’re Definitely Not in a Housing Bubble | MyKCM

Home values appreciated by about ten percent in 2020, and they’re forecast to appreciate by about five percent this year. This has some voicing concern that we may be in another housing bubble like the one we experienced a little over a decade ago. Here are three reasons why this market is totally different.

1. This time, housing supply is extremely limited

The price of any market item is determined by supply and demand. If supply is high and demand is low, prices normally decrease. If supply is low and demand is high, prices naturally increase.

In real estate, supply and demand are measured in “months’ supply of inventory,” which is based on the number of current homes for sale compared to the number of buyers in the market. The normal months’ supply of inventory for the market is about 6 months. Anything above that defines a buyers’ market, indicating prices will soften. Anything below that defines a sellers’ market in which prices normally appreciate.

Between 2006 and 2008, the months’ supply of inventory increased from just over 5 months to 11 months. The months’ supply was over 7 months in twenty-seven of those thirty-six months, yet home values continued to rise.

Months’ inventory has been under 5 months for the last 3 years, under 4 for thirteen of the last fourteen months, under 3 for the last six months, and currently stands at 1.9 months – a historic low.

Remember, if supply is low and demand is high, prices naturally increase.

2. This time, housing demand is real

During the housing boom in the mid-2000s, there was what Robert Schiller, a fellow at the Yale School of Management's International Center for Finance, called “irrational exuberance.” The definition of the term is, “unfounded market optimism that lacks a real foundation of fundamental valuation, but instead rests on psychological factors.” Without considering historic market trends, people got caught up in the frenzy and bought houses based on an unrealistic belief that housing values would continue to escalate.

The mortgage industry fed into this craziness by making mortgage money available to just about anyone, as shown in the Mortgage Credit Availability Index (MCAI) published by the Mortgage Bankers Association. The higher the index, the easier it is to get a mortgage; the lower the index, the more difficult it is to obtain one. Prior to the housing boom, the index stood just below 400. In 2006, the index hit an all-time high of over 868. Again, just about anyone could get a mortgage. Today, the index stands at 122.5, which is well below even the pre-boom level.

In the current real estate market, demand is real, not fabricated. Millennials, the largest generation in the country, have come of age to marry and have children, which are two major drivers for homeownership. The health crisis is also challenging every household to redefine the meaning of “home” and to re-evaluate whether their current home meets that new definition. This desire to own, coupled with historically low mortgage rates, makes purchasing a home today a strong, sound financial decision. Therefore, today’s demand is very real.

Remember, if supply is low and demand is high, prices naturally increase.

3. This time, households have plenty of equity

Again, during the housing boom, it wasn’t just purchasers who got caught up in the frenzy. Existing homeowners started using their homes like ATM machines. There was a wave of cash-out refinances, which enabled homeowners to leverage the equity in their homes. From 2005 through 2007, Americans pulled out $824 billion dollars in equity. That left many homeowners with little or no equity in their homes at a critical time. As prices began to drop, some homeowners found themselves in a negative equity situation where the mortgage was higher than the value of their home. Many defaulted on their payments, which led to an avalanche of foreclosures.

Today, the banks and the American people have shown they learned a valuable lesson from the housing crisis a little over a decade ago. Cash-out refinance volume over the last three years was less than a third of what it was compared to the 3 years leading up to the crash.

This conservative approach has created levels of equity never seen before. According to Census Bureau data, over 38% of owner-occupied housing units are owned ‘free and clear’ (without any mortgage). Also, ATTOM Data Solutions just released their fourth quarter 2020 U.S. Home Equity Report, which revealed:

“17.8 million residential properties in the United States were considered equity-rich, meaning that the combined estimated amount of loans secured by those properties was 50 percent or less of their estimated market value…The count of equity-rich properties in the fourth quarter of 2020 represented 30.2 percent, or about one in three, of the 59 million mortgaged homes in the United States.”

If we combine the 38% of homes that are owned free and clear with the 18.7% of all homes that have at least 50% equity (30.2% of the remaining 62% with a mortgage), we realize that 56.7% of all homes in this country have a minimum of 50% equity. That’s significantly better than the equity situation in 2008.

Bottom Line

This time, housing supply is at a historic low. Demand is real and rightly motivated. Even if there were to be a drop in prices, homeowners have enough equity to be able to weather a dip in home values. This is nothing like 2008. In fact, it’s the exact opposite.