Tuesday, April 23, 2024

Stay ahead of the game with the best way to keep track of mortgage rate trends


The Best Way To Keep Track of Mortgage Rate Trends


If you’re thinking about buying a home, chances are you’ve got mortgage rates on your mind. You’ve heard about how they impact how much you can afford in your monthly mortgage payment, and you want to make sure you’re factoring that in as you plan your move.

The problem is, with all the headlines in the news about rates lately, it can be a bit overwhelming to sort through. Here’s a quick rundown of what you really need to know.

The Latest on Mortgage Rates

Rates have been volatile – that means they’re bouncing around a bit. And, you may be wondering, why? The answer is complicated because rates are affected by so many factors.

Things like what’s happening in the broader economy and the job market, the current inflation rate, decisions made by the Federal Reserve, and a whole lot more have an impact. Lately, all of those factors have come into play, and it’s caused the volatility we’ve seen. As Odeta Kushi, Deputy Chief Economist at First American, explains:

“Ongoing inflation deceleration, a slowing economy and even geopolitical uncertainty can contribute to lower mortgage rates. On the other hand, data that signals upside risk to inflation may result in higher rates.”

Professionals Can Help Make Sense of it All

While you could drill down into each of those things to really understand how they impact mortgage rates, that would be a lot of work. And when you’re already busy planning a move, taking on that much reading and research may feel a little overwhelming. Instead of spending your time on that, lean on the pros.

They coach people through market conditions all the time. They’ll focus on giving you a quick summary of any broader trends up or down, what experts say lies ahead, and how all of that impacts you.

Take this chart as an example. It gives you an idea of how mortgage rates impact your monthly payment when you buy a home. Imagine being able to make a payment between $2,500 and $2,600 work for your budget (principal and interest only). The green part in the chart shows payments in that range or lower based on varying mortgage rates (see chart below):

No Caption Received


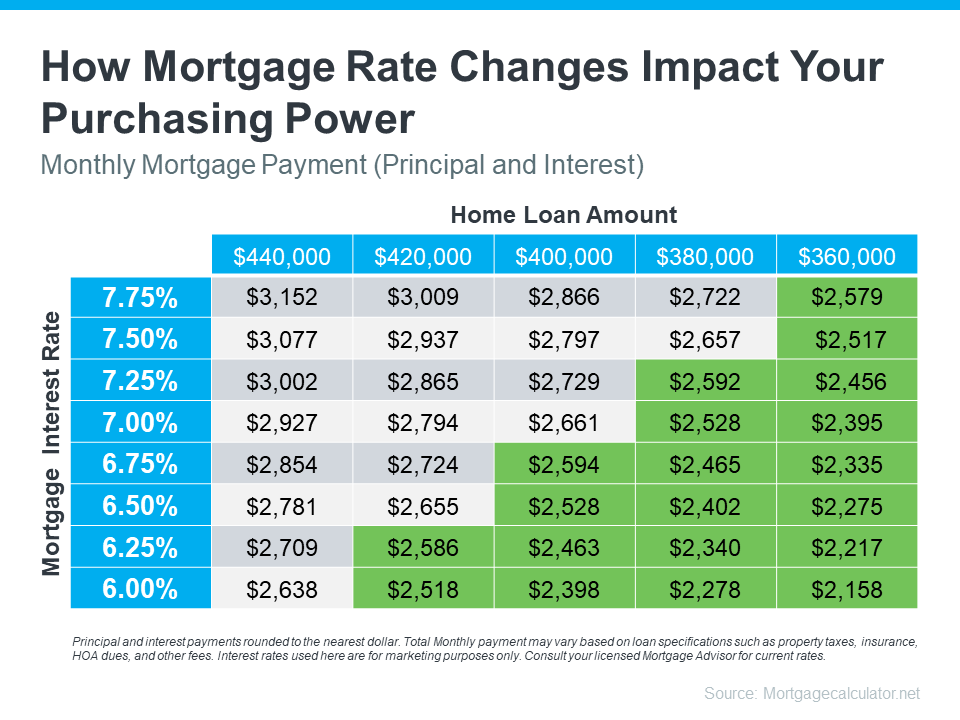
As you can see, even a small shift in rates can impact the loan amount you can afford if you want to stay within that target budget.

It’s tools and visuals like these that take everything that’s happening and show what it actually means for you. And only a pro has the knowledge and expertise needed to guide you through them.

You don’t need to be an expert on real estate or mortgage rates, you just need to have someone who is, by your side.

Bottom Line

Have questions about what’s going on in the housing market? Let’s connect so we can take what’s happening right now and figure out what it really means for you.

Monday, April 22, 2024

Housing News Is Not Immune From Clickbait

What You Really Need To Know About Home Prices


According to recent data from Fannie Mae, almost 1 in 4 people still think home prices are going to come down. If you’re one of the people worried about that, here’s what you need to know.

A lot of that fear is probably coming from what you’re hearing in the media or reading online. But here’s the thing to remember. Negative news sells. That means, you may not be getting the full picture. You may only be getting the clickbait version. As Jay Thompson, a Real Estate Industry Consultant, explains:

“Housing market headlines are everywhere. Many are quite sensational, ending with exclamation points or predicting impending doom for the industry. Clickbait, the sensationalizing of headlines and content, has been an issue since the dawn of the internet, and housing news is not immune to it.”

Here’s a look at the data to set the record straight.

Home Prices Rose the Majority of the Past Year

Case-Shiller releases a report each month on the percent of monthly home price changes. If you look at their data from January 2023 through the latest numbers available, here’s what you’d see:

 a graph of green bars


What do you notice when you look at this graph? It depends on what color you’re more drawn to. If you look at the green, you’ll see home prices rose for the majority of the past year.

But, if you’re drawn to the red, you may only focus on the two slight declines. This is what a lot of media coverage does. Since negative news sells, drawing attention to these slight dips happens often. But that loses sight of the bigger picture. 

Here’s what this data really says. There’s a lot more green in that graph than red. And even for the two red bars, they’re so slight, they’re practically flat. If you look at the year as a whole, home prices still rose overall.

It’s perfectly normal in the housing market for home price growth to slow down in the winter. That’s because fewer people move during the holidays and at the start of the year, so there’s not as much upward pressure on home prices during that time. That’s why, even the green bars toward the end of the year show smaller price gains.

The overarching story is that prices went up last year, not down.

To sum all that up, the source for that data in the graph above, Case Shiller, explains it like this:

Month-over-month numbers were relatively flat, . . . However, the annual growth was more significant for both indices, rising 7.4 percent and 6.6 percent, respectively.”

If one of the expert organizations tracking home price trends says the very slight dips are nothing to worry about, why be concerned? Even Case-Shiller is drawing your attention to how those were virtually flat and how home prices actually grew over the year.

Bottom Line

The data shows that, as a whole, home prices rose over the past year. If you have questions about what’s happening with home prices in our area, let's chat.