Don’t Let These Two Concerns Hold You Back from Selling Your House

If you’re debating whether or not you want to sell right now, it might be because you’ve got some unanswered questions, like if moving really makes sense in today’s market. Maybe you’re wondering if it’s even a good idea to move right now. Or you’re stressed because you think you won't find a house you like.
To put your mind at ease, here’s how to tackle these two concerns head-on.
Is It Even a Good Idea To Move Right Now?
If you own a home already, you may have been holding off because you don’t want to sell and take on a higher mortgage rate on your next house. But your move may be a lot more feasible than you think, and that’s because of your equity.
Equity is the current market value of your home minus what you still owe on your loan. And thanks to the rapid appreciation we saw over the past few years, your equity has gotten a big boost. Just how much are we talking about? See for yourself. As Dr. Selma Hepp, Chief Economist at CoreLogic, explains:
“Persistent home price growth has continued to fuel home equity gains for existing homeowners who now average about $315,000 in equity and almost $129,000 more than at the onset of the pandemic.”
Here’s why this can be such a game-changer when you sell. You can use that equity to put down a larger amount on your next home, which means financing less at today’s mortgage rate. And in some cases, you may even be able to buy your next home in cash, avoiding mortgage rates altogether.
The bottom line? Your equity could be the key to making your next move possible.
Will I Be Able To Find a Home I Like?
If this is on your mind, it’s probably because you remember just how low the supply of homes for sale got over the past few years. It felt nearly impossible to find a home to buy because there were so few available.
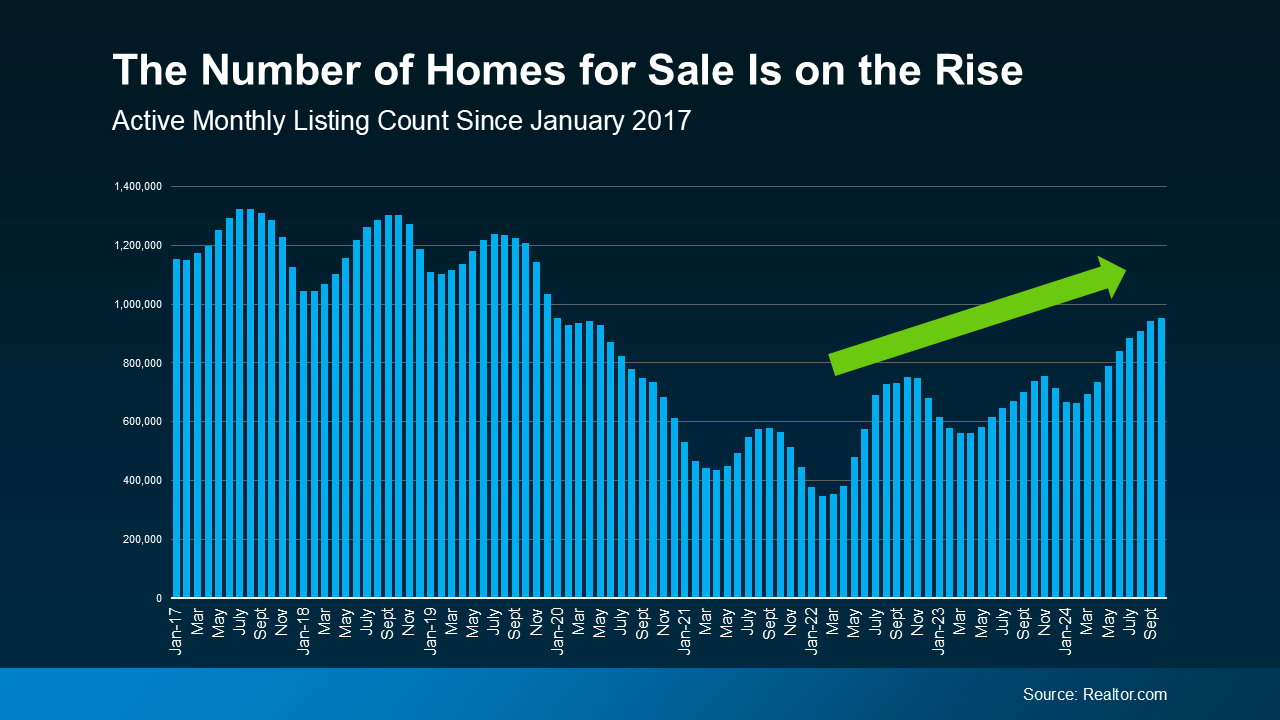
But finding a home in today’s market isn’t as challenging. That’s because the number of homes for sale is growing, giving you more options to choose from. Data from Realtor.com shows just how much inventory has increased – it's up almost 30% year-over-year (see graph below):
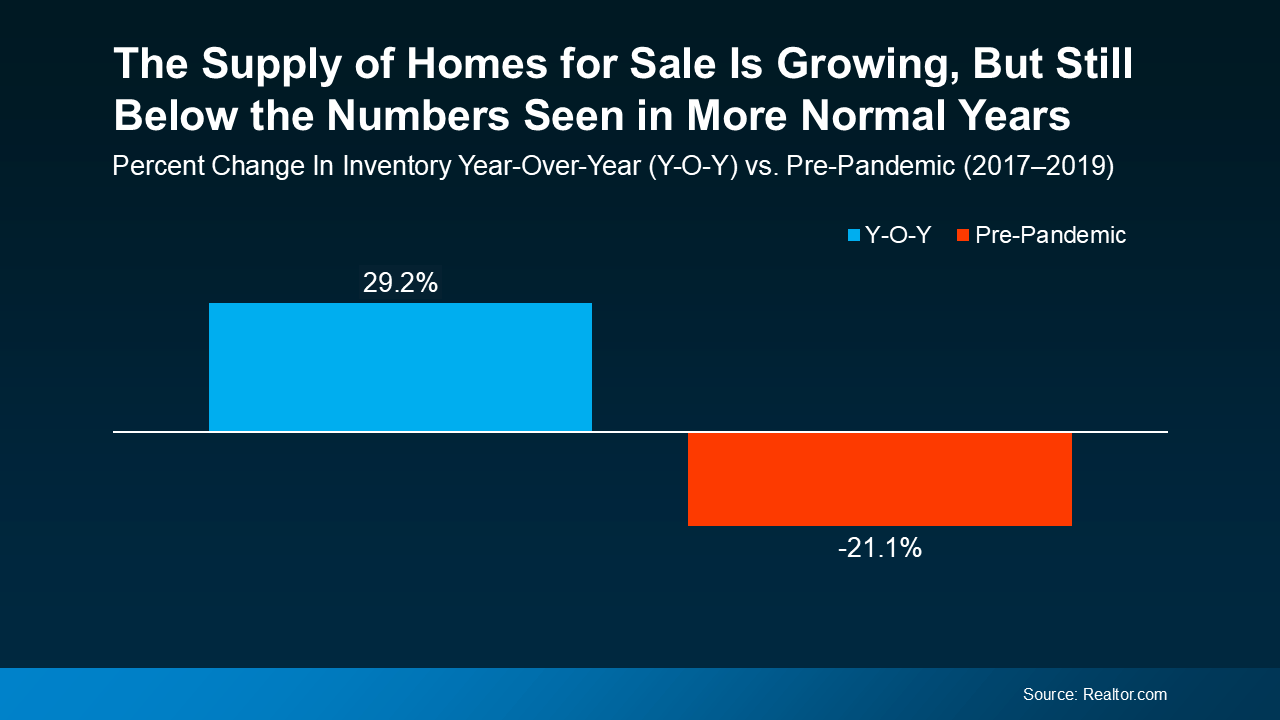 And even though inventory is still below pre-pandemic levels, this is the highest it’s been in quite a while. That means you have more options for your move, but your house should still stand out to buyers at the same time. That’s a sweet spot for you.
It’s important to note, though, that this balance varies by local market. Some places may have more homes for sale than others, so working with a local real estate agent is the best way to see what inventory trends look like in your area.
Bottom Line
If you’re thinking about selling, hopefully these concerns haven’t kept you up at night. With this information, you should realize you don’t have to let the what-if’s delay your move anymore.
Let’s connect so you have the data and the local perspective you need to move forward.