Monday, July 6, 2020

Latest Unemployment Report: Great News…for the Most Part

Latest Unemployment Report: Great News…for the Most Part

Latest Unemployment Report: Great News…for the Most Part | MyKCM

The Bureau of Labor Statistics (BLS) released their latest Employment Situation Summary last Thursday, and it again beat analysts’ expectations in a big way. The consensus was for 3,074,000 jobs to be added in June. The report revealed that 4,800,000 jobs were added. The unemployment rate fell to 11.1% from 13.3% last month. Again, excellent news as the unemployment rate fell for the second consecutive month. However, there’s still a long way to go before the economy fully recovers as 17.8 million Americans remain unemployed.

Here are two interesting insights on the report:

What about a supposed misclassification?

The BLS addressed this at length in a blog post last week, and concluded by saying:

“Regardless of the assumptions we might make about misclassification, the trend in the unemployment rate over the period in question is the same; the rate increased in March & April and eased in May.”

They specifically noted the issue in the latest report by explaining that if they adjusted the rate for the potential miscalculation, it would increase from 11.1% to 12.1% (which is lower than the adjusted rate of 16.4% last month). They went on to say:

“However, this represents the upper bound of our estimate of misclassification and probably overstates the size of the misclassification error.”

Does the shutdown of parts of the economy skew the unemployment numbers?

Because the uniqueness of 2020 impacts the employment situation in so many ways, each jobs report is now examined with a microscope to make sure the headlines generated by the report accurately convey what’s happening in the job market.

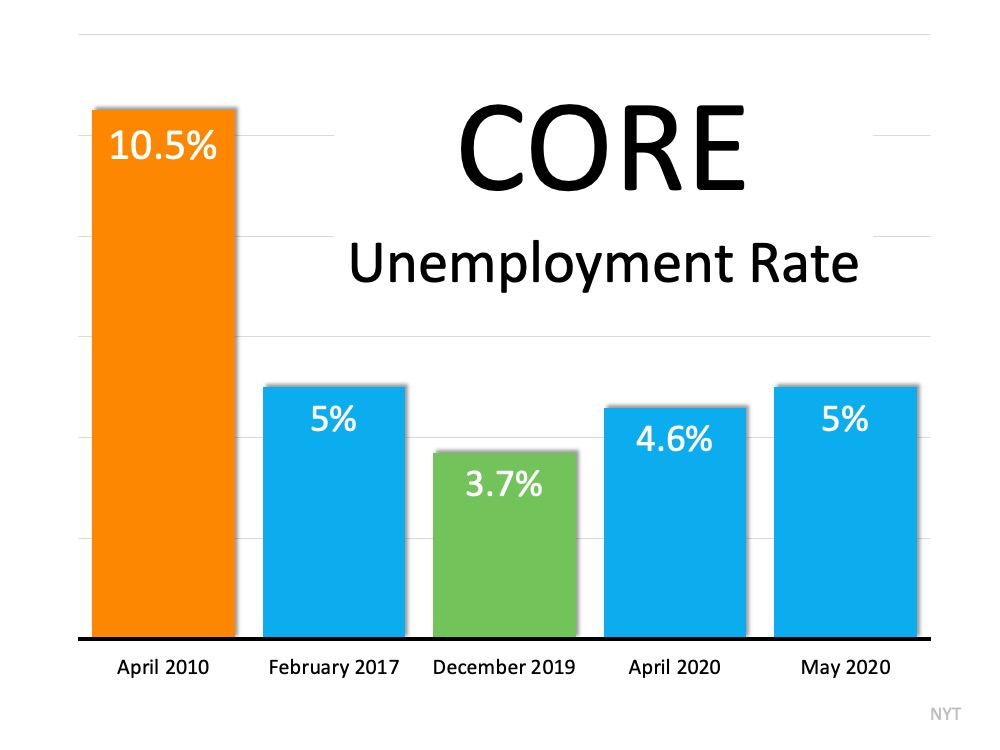
One such analysis is done by Jed Kolko, Chief Economist at Indeed. He believes the extraordinary number of people in the “temporary” unemployed category confuses the broader issue of how many people have permanently lost their job. He adjusts for this when calculating his “core unemployment rate” (which subtracts temporary layoffs and adds unemployed who didn’t search for a job recently).

The bad news is that his analysis reveals that the number of permanently unemployed is still rising (from 4.6% in April to 5.9% last month). The good news, however, is when you use his methodology to look back at the Great Recession, today’s “core unemployment rate” is significantly lower (5.9% versus 10.5% in April 2010).

Bottom Line

Last week’s jobs report was much better than most expected. However, we should remain cautious in our optimism. As the Wall Street Journal explained in their analysis of the jobs report:

“U.S. job growth surged last month, underscoring the economy’s capacity for a quick rebound if businesses continue to reopen and consumers regain confidence. A recent coronavirus spike, however, could undermine trends captured in the latest jobs report.”

Thursday, July 2, 2020

Is the Health Crisis Driving Buyers Out of Urban Areas?

Is the Health Crisis Driving Buyers Out of Urban Areas?

Is the Health Crisis Driving Buyers Out of Urban Areas? | MyKCM

The pandemic has caused consumers to re-examine the components that make up the “perfect home.” Many families are no longer comfortable with the locations and layouts of their existing homes. The allure of city life (more congested) seems to be giving way to either suburban or rural life (less congested). The fascination with an open floor plan seems to be fading as people are finding a need for more privacy while working from home.
Recently, news.com released a report that revealed how buyers’ views of listings are leaning heavily to more suburban and rural properties. Here are the year-over-year percentage increases in views per property type:
  • Urban – 7%
  • Suburban – 13%
  • Rural – 16%
In the report, Javier Vivas, Director of Economic Research for realtor.com, gives these numbers some context:
“This migration to the suburbs is not a new trend, but it has become more pronounced. After several months of shelter-in-place orders, the desire to have more space and the potential for more people to work remotely are likely two of the factors contributing to the popularity of the burbs.”
Realtor Magazine also just reported that the desire to move is strongest in our city markets:
“Nearly 30% of respondents living in a high-density urban area say that the pandemic is prompting them to want to move by the end of the year...This is more than double the rate of those living in rural parts of the country, where residents are much more likely to stay put rather than to relocate.”

New Construction Also Seeing a Surge in Views

Since the pandemic has altered how consumers think about floor plans, builders are anticipating how future homes will change. In a recent press release by Zillow, it was explained that:
  • Builders believe as people spend more time at home during the pandemic, buyers are realizing which features of their homes are working and not working.
  • Homebuilders predict open-concept floor plans will be a thing of the past, as people now value more walls, doors, and overall privacy.
  • New construction, which offers the chance to personalize home features, saw its listing page views grow by 73% over last May.

The Virus is Even Impacting the Luxury Second-Home Market

It appears that COVID-19 is impacting the luxury market too. In an article released last week titled, Luxury Buyers Return to Market in Force, Danielle Hale, Chief Economist for realtor.com reported:
“Stay at home orders and social distancing have put a new value on the extra space. We're seeing this in the luxury market as well, which could mean there is renewed interest from high-end buyers to find a second-home that is within driving distance from their primary residence.
Much like the suburbs are gaining favor with home shoppers, second home markets are seeing increased interest from luxury buyers…Views of luxury properties accelerated 56% in The Hamptons, 28% in Palm Springs and 24% in Greenwich compared to January trends."

Bottom Line

It appears that a percentage of people are preparing to leave many American cities. Some of these moves will be permanent, while others will be temporary (such as a getaway to a second home). In either case, many consumers are on the move. Real estate professionals are ready and willing to help in any way they can.

Wednesday, July 1, 2020

A Historic Rebound for the Housing Market

A Historic Rebound for the Housing Market

A Historic Rebound for the Housing Market | MyKCM

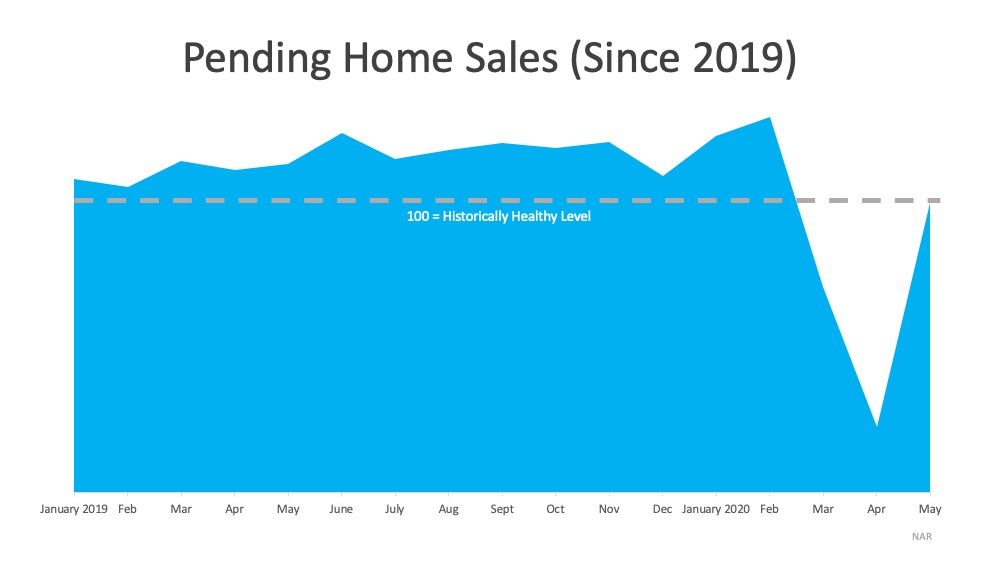
Pending Home Sales increased by 44.3% in May, registering the highest month-over-month gain in the index since the National Association of Realtors (NAR) started tracking this metric in January 2001. So, what exactly are pending home sales, and why is this rebound so important?
According to NAR, the Pending Home Sales Index (PHS) is:
“A leading indicator of housing activity, measures housing contract activity, and is based on signed real estate contracts for existing single-family homes, condos, and co-ops. Because a home goes under contract a month or two before it is sold, the Pending Home Sales Index generally leads Existing-Home Sales by a month or two.”
In real estate, pending home sales is a key indicator in determining the strength of the housing market. As mentioned before, it measures how many existing homes went into contract in a specific month. When a buyer goes through the steps to purchase a home, the final one is the closing. On average, that happens about two months after the contract is signed, depending on how fast or slow the process takes in each state.

Why is this rebound important?

With the COVID-19 pandemic and a shutdown of the economy, we saw a steep two-month decline in the number of houses that went into contract. In May, however, that number increased dramatically (See graph below):A Historic Rebound for the Housing Market | MyKCMThis jump means buyers are back in the market and purchasing homes right now. Lawrence Yun, Chief Economist at NAR mentioned:
“This has been a spectacular recovery for contract signings and goes to show the resiliency of American consumers and their evergreen desire for homeownership…This bounce back also speaks to how the housing sector could lead the way for a broader economic recovery.”
But in order to continue with this trend, we need more houses for sale on the market. Yun continues to say:
“More listings are continuously appearing as the economy reopens, helping with inventory choices…Still, more home construction is needed to counter the persistent underproduction of homes over the past decade.”
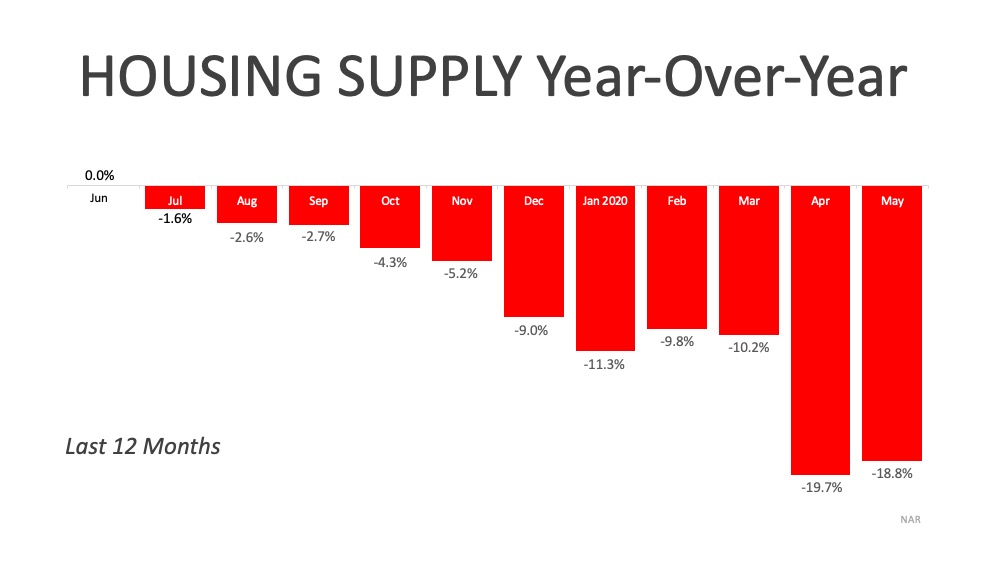
As we move through the year, we’ll see an increase in the number of houses being built. This will help combat a small portion of the inventory deficit. The lack of overall inventory, however, is still a challenge, and it is creating an opportunity for homeowners who are ready to sell. As the graph below shows, during the last 12 months, the supply of homes for sale has been decreasing year-over-year and is not keeping up with the demand from homebuyers.A Historic Rebound for the Housing Market | MyKCM

Bottom Line

If you decided not to sell this spring due to the health crisis, maybe it’s time to jump back into the market while buyers are actively looking for homes. Let’s connect today to determine your best move forward.

Tuesday, June 30, 2020

Are New Homes Going to Be Available to Buy This Year?

Are New Homes Going to Be Available to Buy This Year?

Are New Homes Going to Be Available to Buy This Year? | MyKCM

In today’s economy, everyone seems to be searching for signs that a recovery is coming soon. Many experts agree that it may actually already be in motion or will be starting by the 3rd quarter of this year. With the housing market positioned to lead the way out of this recession, builder confidence might be a bright spark that gets the recovery fire started. The construction of new homes coming right around the corner is a huge part of that effort, and it may drive your opportunity to make a move this year.
According to the National Association of Home Builders (NAHB): 
“New home sales jumped in May, as housing demand was supported by low interest rates, a renewed household focus on housing, and rising demand in lower-density markets. Census and HUD estimated new home sales in May at a 676,000 seasonally adjusted annual pace, a 17% gain over April.” 
In addition, builder confidence is also rising, opening up opportunity for newly constructed homes in the market. The NAHB also notes:
“In a sign that housing stands poised to lead a post-pandemic economic recovery, builder confidence in the market for newly-built single-family homes jumped 21 points to 58 in June, according to the latest National Association of Home Builders/Wells Fargo Housing Market Index (HMI). Any reading above 50 indicates a positive market.”
As noted above, this upward trend is supported by builders reporting an increase in demand for single-family homes in suburban neighborhoods with lower-density populations, a result of the COVID-19 health crisis.
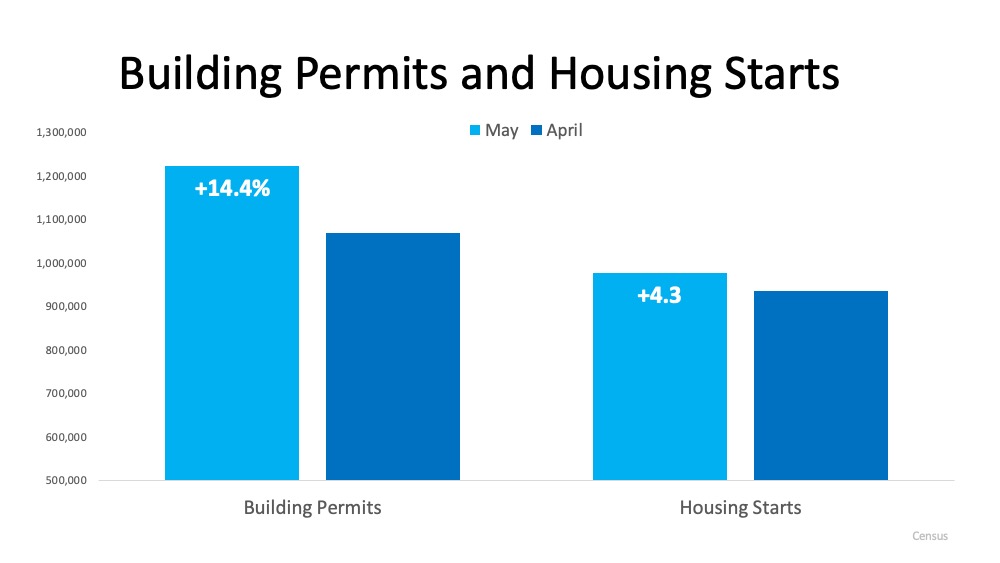
Moreover, the most recent Monthly New Residential Construction Report from the U.S. Census indicates that authorized building permits for new residential construction increased by 14.4% month-over-month from April to May, and housing starts were also up 4.3% over the same time period. (See graph below):Are New Homes Going to Be Available to Buy This Year? | MyKCMAlthough housing permits and starts are both considerably lower than they were at this time last year, indicating the new construction market is still working on building its way back up, the trends are moving in the right direction when it comes to having an impact on the U.S. economy. They’re also poised to create the much-needed new homes for Americans to purchase in a time when inventory is so scarce.
Dean Mon, Chairman of the NAHB notes:
“As the nation reopens, housing is well-positioned to lead the economy forward…Inventory is tight, mortgage applications are increasing, interest rates are low and confidence is rising. And buyer traffic more than doubled in one month even as builders report growing online and phone inquiries stemming from the outbreak.”
The gap between homes to buy and the high demand from purchasers may be narrowed by new construction, and the data shows that these homes are on their way into the housing market.
So, if you’ve debated whether or not to sell your house this year because you’re not sure where to move, a newly-built home – designed to your specific liking – may be your answer.

Bottom Line

With new residential construction right around the corner, you can feel confident about selling your house and having a place to move into. Maybe it’s time to finally design the home you’ve always wanted. Let’s connect today to discuss selling your house while demand from eager buyers is high.

Monday, June 29, 2020

What Are Experts Saying About the Rest of 2020?

What Are Experts Saying About the Rest of 2020?

What Are Experts Saying About the Rest of 2020? | MyKCM

One of the biggest questions on everyone’s minds these days is: What’s going to happen to the housing market in the second half of the year? Based on recent data on the economy, unemployment, real estate, and more, many economists are revising their forecasts for the remainder of 2020 – and the outlook is extremely encouraging. Here’s a look at what some experts have to say about key areas that will power the industry and the economy forward this year.

Mortgage Purchase Originations: Joel Kan, Associate Vice President of Economic and Industry ForecastingMortgage Bankers Association

“The recovery in housing is happening faster than expected. We anticipated a drop off in Q3. But, we don’t think that’s the case anymore. We revised our Q3 numbers higher. Before, we predicted a 2 percent decline in purchase originations in 2020, now we think there will be 2 percent growth this year.”

Home Sales: Lawrence Yun, Chief Economist, National Association of Realtors

“Sales completed in May reflect contract signings in March and April – during the strictest times of the pandemic lock down and hence the cyclical low point...Home sales will surely rise in the upcoming months with the economy reopening, and could even surpass one-year-ago figures in the second half of the year.”

Inventory: George Ratiu, Senior Economist, realtor.com

“We can project that the next few months will see a slow-yet-steady improvement in new inventory...we projected a stepped improvement for the May through August months, followed by a return to historical trend for the September through December time frame."

Mortgage Rates: Freddie Mac

“Going forward, we forecast the 30-year fixed-rate mortgage to remain low, falling to a yearly average of 3.4% in 2020 and 3.2% in 2021.”

New Construction: Doug Duncan, Chief Economist, Fannie Mae

“The weaker-than-expected single-family starts number may be a matter of timing, as single-family permits jumped by a stronger 11.9 percent. In addition, the number of authorized single-family units not yet started rose 5.4 percent to the second-highest level since 2008. This suggests that a significant acceleration in new construction will likely occur.”

Bottom Line

The experts are optimistic about the second half of the year. If you paused your 2020 real estate plans this spring, let’s connect today to determine how you can re-engage in the process.

Thursday, June 25, 2020

New Index Reveals Impact of COVID-19 on Real Estate

New Index Reveals Impact of COVID-19 on Real Estate

New Index Reveals Impact of COVID-19 on Real Estate | MyKCM

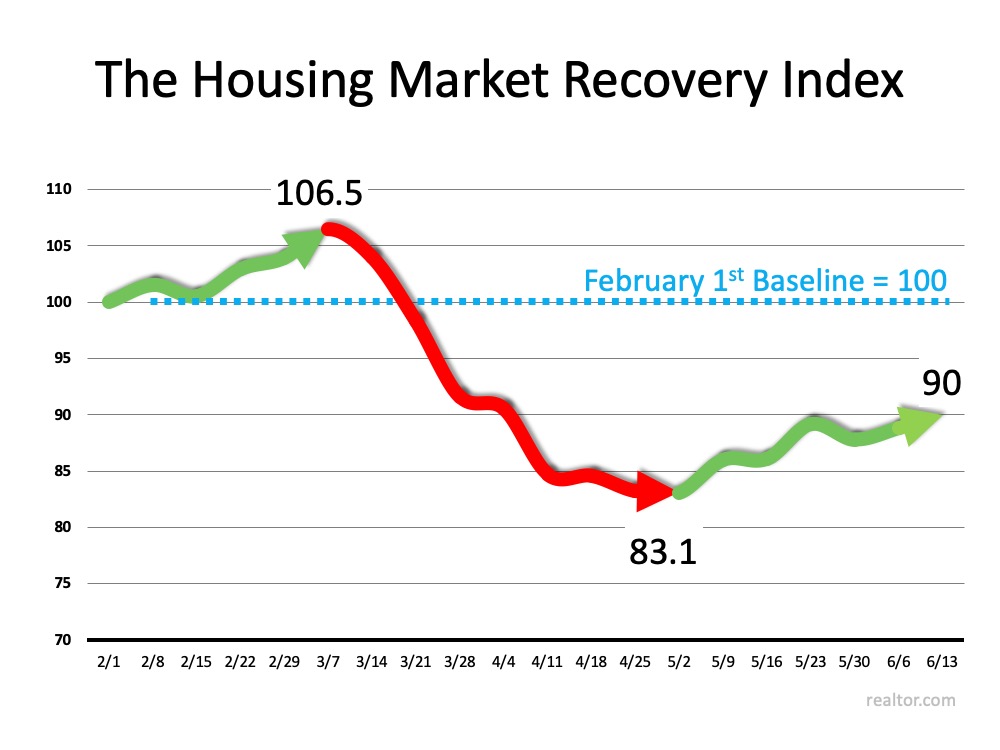
Earlier this month, realtor.com announced the release of their initial Housing Recovery Index, a weekly guide showing how the pandemic has impacted the residential real estate market. The index leverages a weighted average of four key components of the housing industry, tracking each of the following:

  1. Housing Demand – Growth in online search activity
  2. Home Price – Growth in asking prices
  3. Housing Supply – Growth of new listings
  4. Pace of Sales – Difference in time-on-market

The index then compares the current status “to the last week of January 2020 market trend, as a baseline for pre-COVID market growth. The overall index is set to 100 in this baseline period. The higher a market's index value, the higher its recovery and vice versa.”

The graph below charts the index by showing how the real estate market started out strong in early 2020, and then dropped dramatically at the beginning of March when the pandemic paused the economy. It also shows the strength of the recovery since the beginning of May.New Index Reveals Impact of COVID-19 on Real Estate | MyKCMIt’s clear to see that the housing market is showing promising signs of recovery from the deep economic cuts we experienced earlier this spring. As noted by Dean Mon, Chairman of the National Association of Home Builders (NAHB):

“As the nation reopens, housing is well-positioned to lead the economy forward.”

The data today indicates the housing market is already on the way up.

Bottom Line

Staying connected to the housing market’s performance over the coming months will be essential, as we continue to evaluate exactly how the housing market is doing in this uncharted time ahead.

Wednesday, June 24, 2020

Should We Be Looking at Unemployment Numbers Differently?

Should We Be Looking at Unemployment Numbers Differently?

Should We Be Looking at Unemployment Numbers Differently? | MyKCM

The New York Times recently ran an article regarding unemployment titled: Don’t Cheer Too Soon. Keep an Eye on the Core Jobless Rate. The piece suggests we should look at unemployment numbers somewhat differently. The author of the article, Jed Kolko, is a well-respected economist who is currently the Chief Economist at Indeed, the world’s largest online jobs site. Previously, he was Chief Economist and VP of Analytics at Trulia, the online real estate site.

Kolko suggests “the coronavirus pandemic has broken most economic charts and models, and all the numbers we regularly watch need a closer look.” He goes on to explain that the decline in the unemployment number reported by the Bureau of Labor Statistics (BLS) earlier this month was driven by a drop in temporary layoffs. If we strip those out, we’re left with what Kolko calls the core unemployment rate. Many economists have struggled with how to deal with the vast number of temporary layoffs, as a complete shutdown of the economy has never happened before. As the article states, in the last unemployment report:

“73 percent of all unemployed people said they were temporarily unemployed, which means they had a return-to-work date or they expected to return to work in six months. Before the pandemic, temporary unemployment was never more than one-quarter of total unemployment.”

The core unemployment rate handles this issue and also deals with another concern economists have discussed for years: the exclusion of the marginally attached. These are people who are available and want to work, but count as out of the labor force rather than unemployed because they haven’t searched for work in the past four weeks.

Kolko’s core rate does three things:

  1. Takes out temporary unemployment
  2. Retains the rest of the standard unemployment definition: permanent job losers, job leavers, and people returning to or entering the labor force
  3. Adds in the marginally attached

Removing the temporarily unemployed makes sense according to the article:

“Initial pandemic relief efforts focused on money for people to manage a temporary loss of income and funds to keep businesses afloat until they could bring their workers back. The hope and the goal is for the temporarily unemployed to return to their old jobs, rather than have them lose their jobs and have to search for new ones when jobs have become scarcer.”

The Bad News and the Good News

Clearly, the adjustments Kolko makes dramatically impact the way we look at unemployment. The bad news is, using his core rate, there was an increase in unemployment from April to May. The conventional rate reported by the BLS showed a decrease in unemployment.

The good news is that the core rate compares more favorably to the last recession in 2008. Here’s the breakdown:Should We Be Looking at Unemployment Numbers Differently? | MyKCM

Bottom Line

The unemployment rate is a key indicator of how the economy is doing. Heading into a highly contested election this November, the BLS report releasing next week will be scrutinized like no other by members on both sides of the aisle. Mr. Kolko’s take is just one additional way to evaluate how unemployment is impacting American families.