Monday, March 16, 2020

5 Simple Graphs Proving This Is NOT Like the Last Time

5 Simple Graphs Proving This Is NOT Like the Last Time

5 Simple Graphs Proving This Is NOT Like the Last Time | MyKCM

With all of the volatility in the stock market and uncertainty about the Coronavirus (COVID-19), some are concerned we may be headed for another housing crash like the one we experienced from 2006-2008. The feeling is understandable. Ali Wolf, Director of Economic Research at the real estate consulting firm Meyers Research, addressed this point in a recent interview:
“With people having PTSD from the last time, they’re still afraid of buying at the wrong time.”
There are many reasons, however, indicating this real estate market is nothing like 2008. Here are five visuals to show the dramatic differences.

1. Mortgage standards are nothing like they were back then.

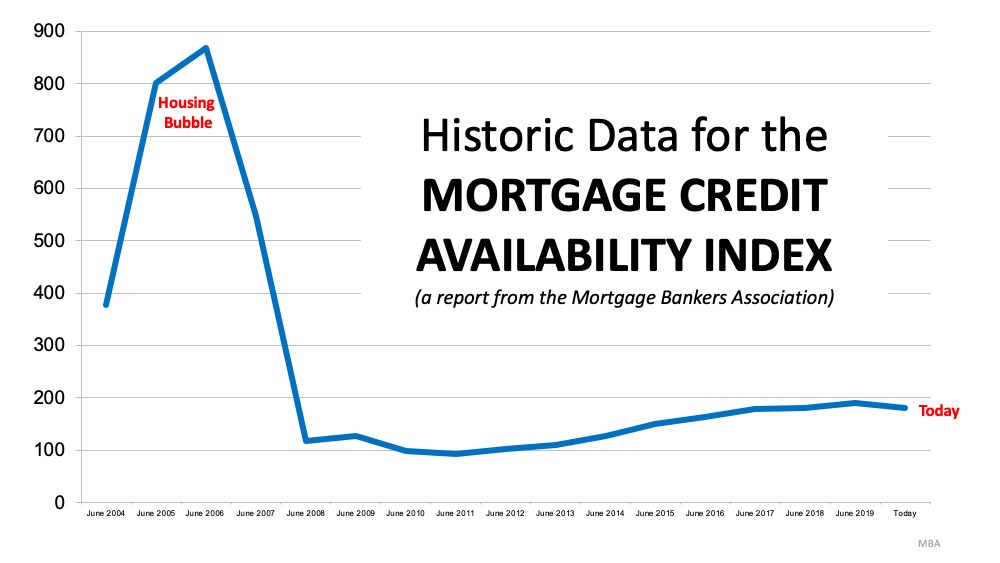
During the housing bubble, it was difficult NOT to get a mortgage. Today, it is tough to qualify. The Mortgage Bankers’ Association releases a Mortgage Credit Availability Index which is “a summary measure which indicates the availability of mortgage credit at a point in time.” The higher the index, the easier it is to get a mortgage. As shown below, during the housing bubble, the index skyrocketed. Currently, the index shows how getting a mortgage is even more difficult than it was before the bubble.5 Simple Graphs Proving This Is NOT Like the Last Time | MyKCM
2. Prices are not soaring out of control.

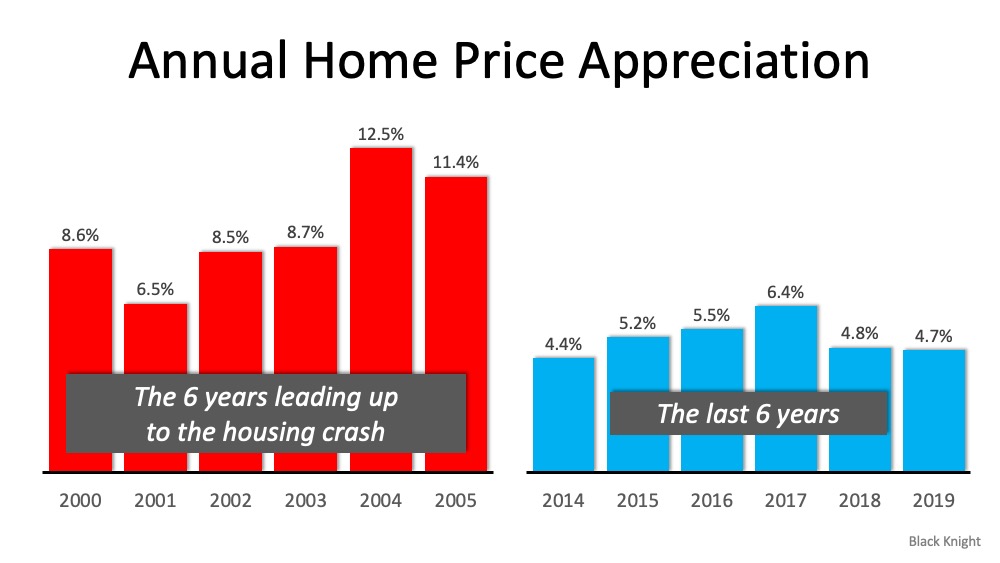
Below is a graph showing annual house appreciation over the past six years, compared to the six years leading up to the height of the housing bubble. Though price appreciation has been quite strong recently, it is nowhere near the rise in prices that preceded the crash.5 Simple Graphs Proving This Is NOT Like the Last Time | MyKCMThere’s a stark difference between these two periods of time. Normal appreciation is 3.6%, so while current appreciation is higher than the historic norm, it’s certainly not accelerating beyond control as it did in the early 2000s.
3. We don’t have a surplus of homes on the market. We have a shortage.

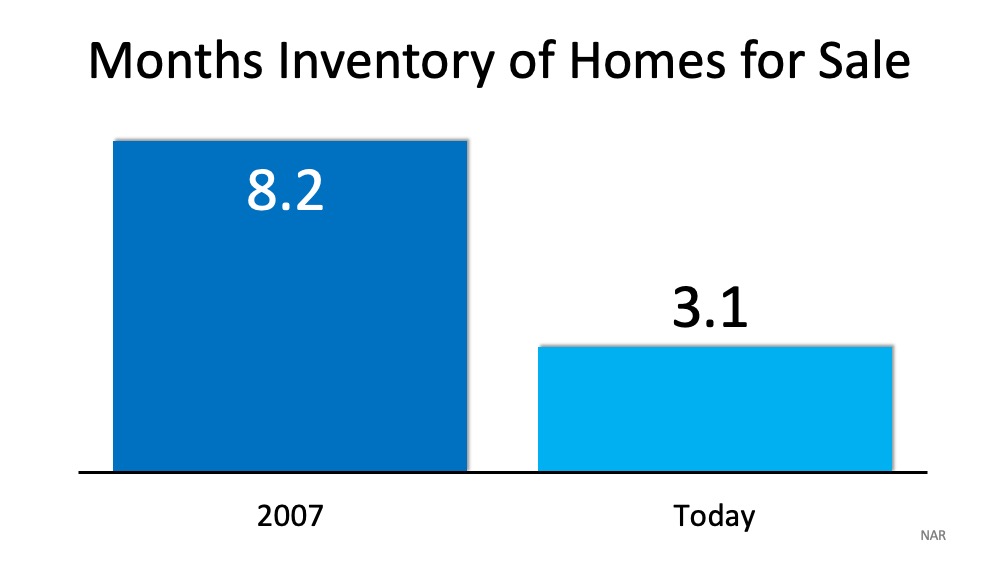
The months’ supply of inventory needed to sustain a normal real estate market is approximately six months. Anything more than that is an overabundance and will causes prices to depreciate. Anything less than that is a shortage and will lead to continued appreciation. As the next graph shows, there were too many homes for sale in 2007, and that caused prices to tumble. Today, there’s a shortage of inventory which is causing an acceleration in home values.5 Simple Graphs Proving This Is NOT Like the Last Time | MyKCM
4. Houses became too expensive to buy.

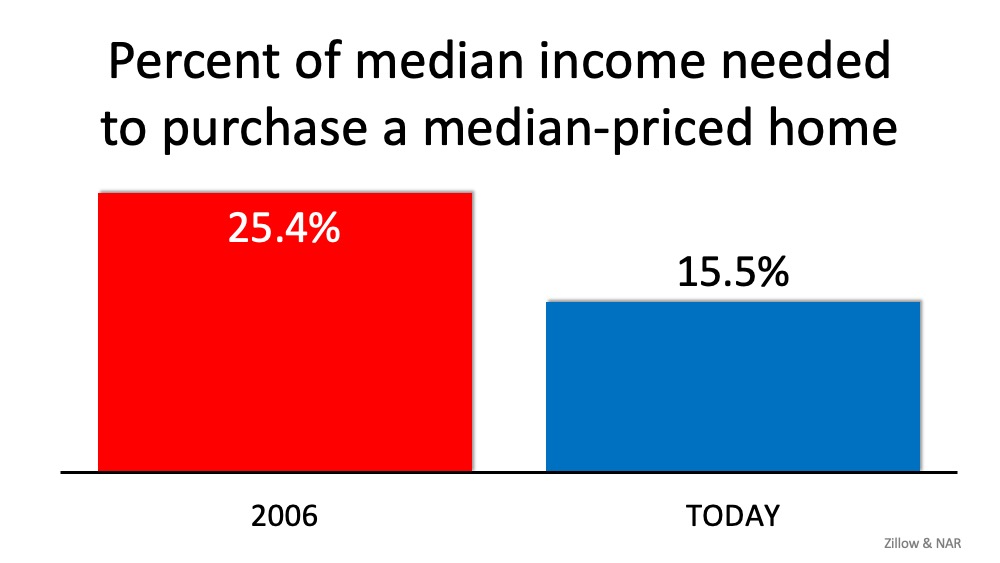
The affordability formula has three components: the price of the home, the wages earned by the purchaser, and the mortgage rate available at the time. Fourteen years ago, prices were high, wages were low, and mortgage rates were over 6%. Today, prices are still high. Wages, however, have increased and the mortgage rate is about 3.5%. That means the average family pays less of their monthly income toward their mortgage payment than they did back then. Here’s a graph showing that difference:5 Simple Graphs Proving This Is NOT Like the Last Time | MyKCM
5. People are equity rich, not tapped out.

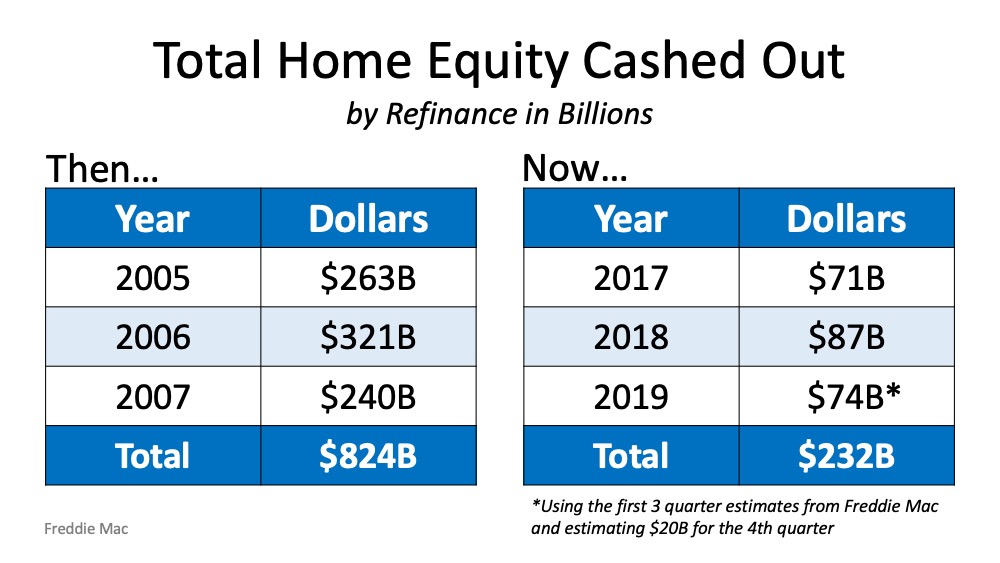
In the run-up to the housing bubble, homeowners were using their homes as a personal ATM machine. Many immediately withdrew their equity once it built up, and they learned their lesson in the process. Prices have risen nicely over the last few years, leading to over fifty percent of homes in the country having greater than 50% equity. But owners have not been tapping into it like the last time. Here is a table comparing the equity withdrawal over the last three years compared to 2005, 2006, and 2007. Homeowners have cashed out over $500 billion dollars less than before:5 Simple Graphs Proving This Is NOT Like the Last Time | MyKCMDuring the crash, home values began to fall, and sellers found themselves in a negative equity situation (where the amount of the mortgage they owned was greater than the value of their home). Some decided to walk away from their homes, and that led to a rash of distressed property listings (foreclosures and short sales), which sold at huge discounts, thus lowering the value of other homes in the area. That can’t happen today.
Bottom Line

If you’re concerned we’re making the same mistakes that led to the housing crash, take a look at the charts and graphs above to help alleviate your fears.

Friday, March 13, 2020

Buying a Home: Do You Know the Lingo?

Buying a Home: Do You Know the Lingo? [INFOGRAPHIC]

Buying a Home: Do You Know the Lingo? [INFOGRAPHIC] | MyKCM

Highlights:

  • Buying a home can be intimidating if you’re not familiar with the terms used throughout the process.
  • To point you in the right direction, here’s a list of some of the most common language you’ll hear along the way.
  • The best way to ensure your homebuying process is a positive one is to find a real estate professional who will guide you through every aspect of the transaction with ‘the heart of a teacher.’

Thursday, March 12, 2020

Yes, You Can Still Afford a Home

Yes, You Can Still Afford a Home

Yes, You Can Still Afford a Home | MyKCM

The residential real estate market has come roaring out of the gates in 2020. Compared to this time last year, the number of buyers looking for a home is up 20%, and the number of home sales is up almost 10%. The increase in purchasing activity has caused home price appreciation to begin reaccelerating. Many analysts have boosted their projections for price appreciation this year.
Whenever home prices begin to increase, there’s an immediate concern about how that will impact the ability Americans have to purchase a home. That thinking is understandable. We must, however, realize that price is not the only element to the affordability equation. Mark Fleming, Chief Economist at First American, recently explained:
“When demand increases for a scarce (limited or low supply) good, prices will rise faster. The difference between houses and other goods is that we buy them with a mortgage. So, it’s not the actual price that matters, but the price relative to purchasing power.”
While home prices have risen recently, mortgage interest rates have fallen rather dramatically. At the beginning of last year, the 30-year fixed-rate mortgage stood at 4.46%. Today, that number stands over a full percentage point lower.

How does a lower mortgage rate impact your monthly mortgage payment?

Michael Hyman, a research data specialist for the National Association of Realtors (NAR), explained in a recent report that, even though home values have increased over the last year, the monthly cost of owning a home has decreased:
“With lower mortgage rates compared to one year ago, the payment as a percentage of income fell to 15.5%…from 17.1% a year ago.”
When purchasing a home, the price is not as important as its cost. Today, the monthly expense (cost) of purchasing the same house you could have purchased last year would be less. Or, you could purchase a more expensive home for the same monthly expense.
Fleming, looking at all aspects of the affordability equation (prices, wages, and mortgage rates), calculated the actual numbers in a recent blog post:
“Low mortgage rates and income growth triggered a 13.5% increase in house-buying power compared with a year ago.”
Since wages have increased and mortgage rates have dropped to historically low levels, this is a great time to buy your first home or move up to the home of your dreams. As Tendayi Kapfidze, Chief Economist at LendingTreerecently advised:
“If you are in a point in your life where you’re considering buying a home today, it’s a better time to buy than 10 years ago. If you can get a mortgage, you’re getting much lower interest rates, and it enables you to afford more.”

Bottom Line

Whether you’ve considered becoming a homeowner for the first time or have decided to sell your home and buy one that better suits your current lifestyle, now is a great time to get together and discuss your options.

Wednesday, March 11, 2020

Confidence Is the Key to Success for Young Homebuyers

Confidence Is the Key to Success for Young Homebuyers | MyKCM

Buying your first home can seem overwhelming. Thankfully, there’s a lot of great information out there to help you feel more confident as you learn about the process. For those in younger generations who aspire to buy, here are three things to consider sooner rather than later in your journey:

1. Understand What it Takes to Purchase a Home

Overall, Millennials make up the largest group of homebuyers in today’s real estate market, and Gen Z is not too far behind. A recent study shared by Freddie Mac shows, however, that Generation Z isn’t as confident in the homebuying process as Millennials. The best thing potential young buyers can do is understand what it takes to buy a home. Learn as much as you can about the mortgage processdown payment options, and the overall steps to take along the way. 

2. Realize Your Opportunity to Build Wealth 

Homeownership allows you the chance to put a small portion of the home’s value down when you buy, and then watch your appreciation grow on the full value of the home – not just on the down payment. It’s one of the best investments you can make, and a form of forced savings working in your favor over time. The added bonus? You get to live there, too.

3. Find Someone You Trust to Help You Through the Process 

Having someone you trust to guide you through this process is invaluable. Finding a local real estate expert to help you navigate through the transaction and feel more confident as you make important decisions could be the best choice you make.
For Millennials and Gen Z’ers thinking about buying, today’s historically low interest rates combined with the outlook for future home appreciation is a big win. This means whatever you buy today, you’ll be bragging about 10 years from now. You can feel confident about that!

Bottom Line

If you’re ready, buying your first home sooner rather than later is one of the best decisions you can make. But there are many things to consider before taking that step, so let’s work together to help you confidently navigate the full journey.

Tuesday, March 10, 2020

Equity Gain Growing in Nearly Every State

Equity Gain Growing in Nearly Every State

Equity Gain Growing in Nearly Every State | MyKCM

Rising home prices have been in the news a lot lately, and much of the focus is on whether they’re accelerating too quickly and how sustainable the growth in prices really is. One of the often-overlooked benefits of rising prices, however, is the impact they have on a homeowner’s equity position.
Home equity is defined as the difference between a home's fair market value and the outstanding balance of all liens on the property. While homeowners pay down their mortgages, the amount of equity they have in their homes climbs each time the value increases.
Today, the number of homeowners that currently have significant equity in their homes is growing. According to the Census Bureau, 38% of all homes in the country are mortgage-free.  In a home equity studyATTOM Data Solutions revealed that of the 54.5 million homes with a mortgage, 26.7% of them have at least 50% equity. That number has been increasing over the last eight years.
CoreLogic also notes:
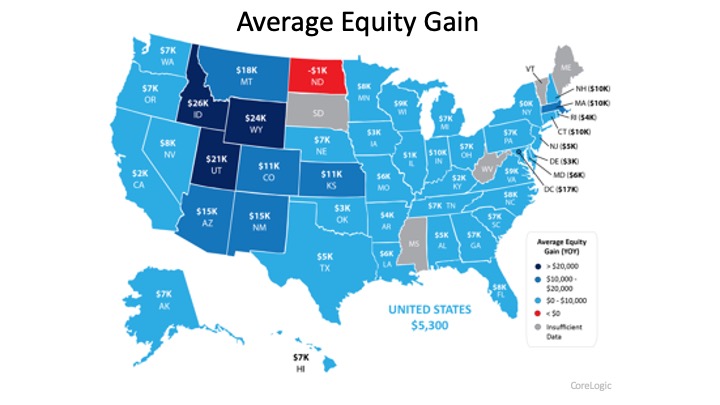
“…the average homeowner gained approximately $5,300 in equity during the past year.”
The map below shows a breakdown of the increasing equity gain across the country, painting a clear picture that home equity is growing in nearly every state.Equity Gain Growing in Nearly Every State | MyKCM

Bottom Line

This may be the year to take advantage of your home equity by applying it forward, either as you downsize or as you move up to a new home.

Monday, March 9, 2020

New Homes Coming to the Housing Market This Year

New Homes Coming to the Housing Market This Year

New Homes Coming to the Housing Market This Year | MyKCM

The number of building permits issued for single-family homes is the best indicator of how many newly built homes will begin to come to market over the next few months. According to the latest U.S. Census Bureau and U.S. Department of Housing & Urban Development Residential Construction Report, the number of building permits issued in January was 1,551,000. This is a 9.2% increase from December.

How will this impact buyers?

New inventory means more options. Lawrence Yun, Chief Economist at the National Association of Realtors (NAR), explained how this is good news for the housing market – especially for those looking to buy:
“More construction will mean more housing inventory for consumers in the later months of this year…Spring months could still be quite tough for buyers since it takes time to convert housing starts into actual housing completions.”

How will this impact sellers?

More inventory means more competition. Yun continues to say:
“As trade-up buyers move into these newly completed homes in the near future, their existing homes will be released onto the market.”
Today, because of the tremendous lack of inventory, a seller can potentially anticipate:
  1. great sale price on their house as buyers engage in potential bidding wars.
  2. quick sale as buyers have little inventory to choose from.
  3. Fewer hassles as buyers want to smoothly secure a contract.

Bottom Line

If you’re considering selling your house, you’ll want to list sooner rather than later. This way, you’ll get ahead of this new competition coming to market and ensure the most attention toward your listing and the best price for your house.

Friday, March 6, 2020

The Difference an Hour Makes [INFOGRAPHIC]

The Difference an Hour Makes [INFOGRAPHIC] | MyKCM

Some Highlights:

  • Don’t forget to set your clocks forward this Sunday, March 8 at 2:00 AM EST in observance of Daylight Saving Time, unless you’re a resident of Arizona or Hawaii!
  • Every hour in the United States, 568 homes are sold and median home values rise by $1.92.
  • As we “spring forward” this year, let’s get together to see how you can take advantage of every hour in the housing market.